Welcome to Advanced GIS, Lecture 2
This is a web page that can be viewed as slides.
→ to move forward
← to go back
Next week: final project thoughts
tell me about:
Something you would like to work on as your final project.
Past work you're excited about that might be a good interactive map.
Projects that others have done that you might like to emulate.
Thoughts about the geoweb—what inspires you about online maps?
Map-related skills that you would like to acquire, in this course or at a later date.
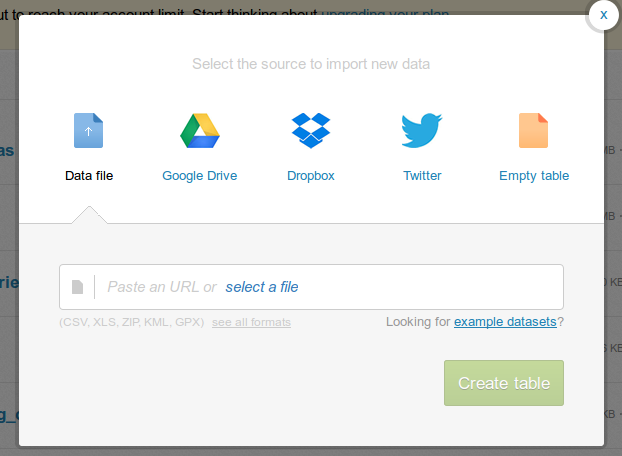
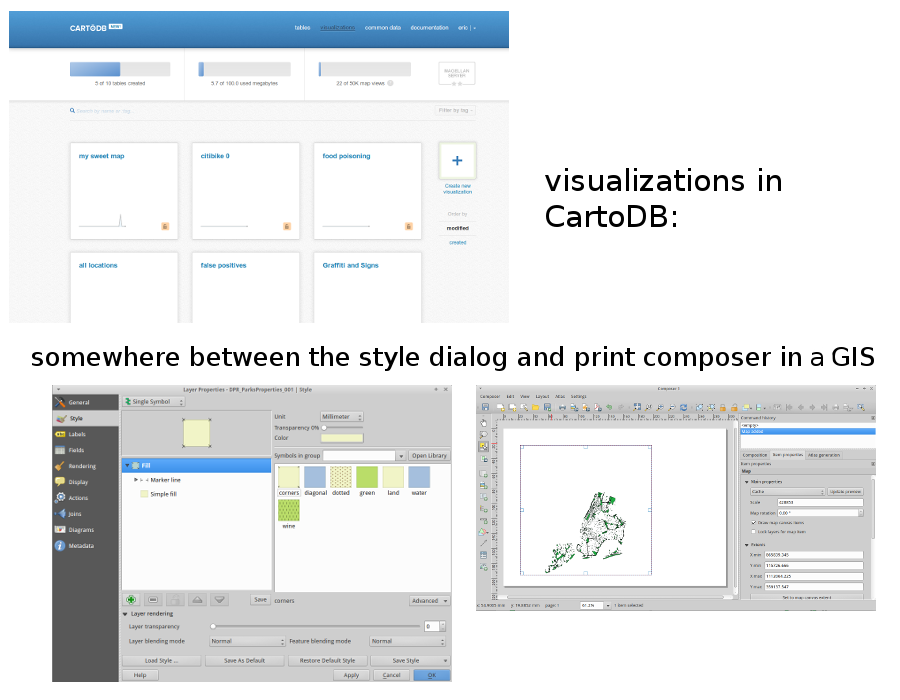
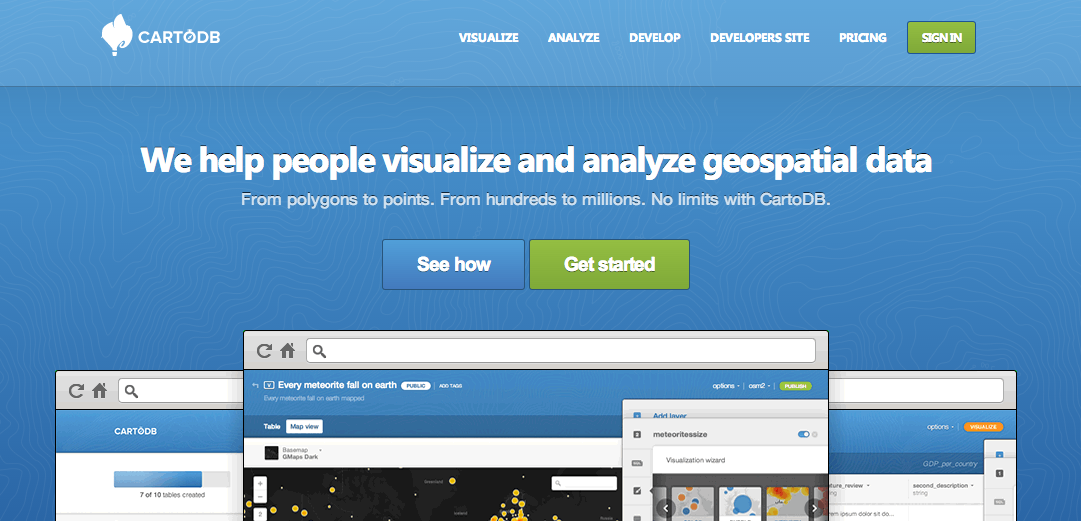
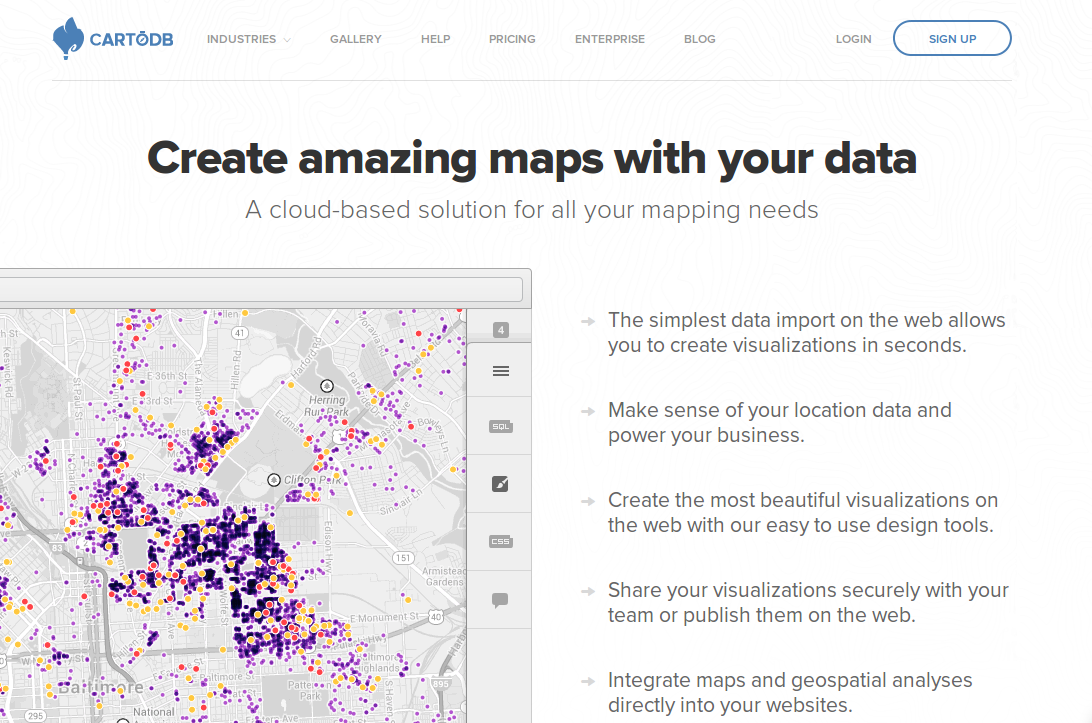
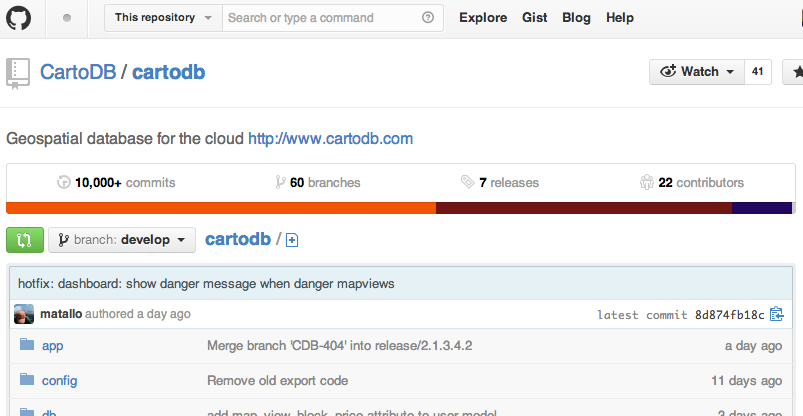
CartoDB
"free as in speech"
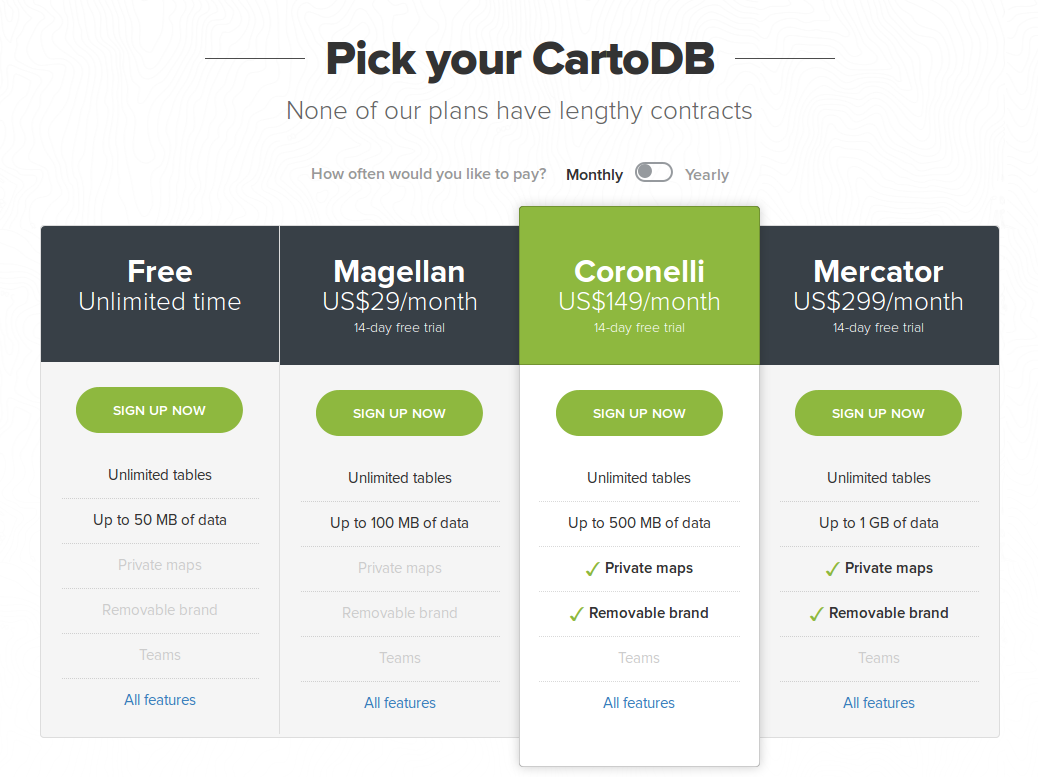
"free as in beer"
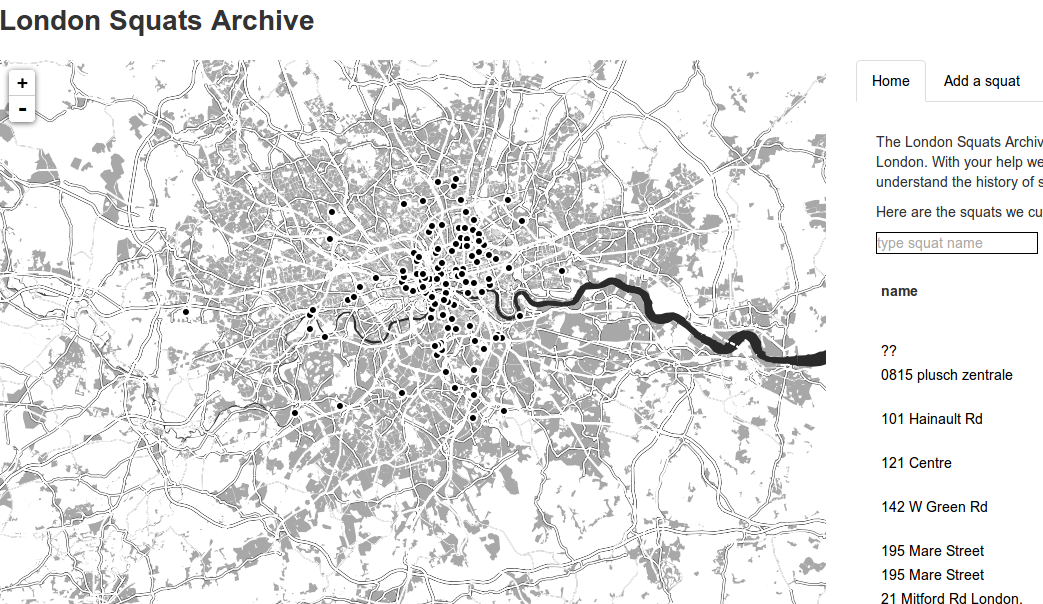
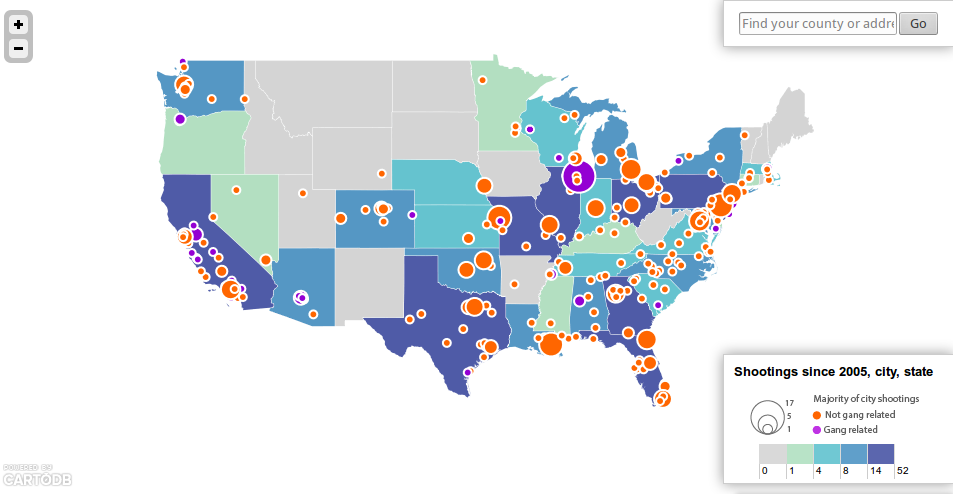
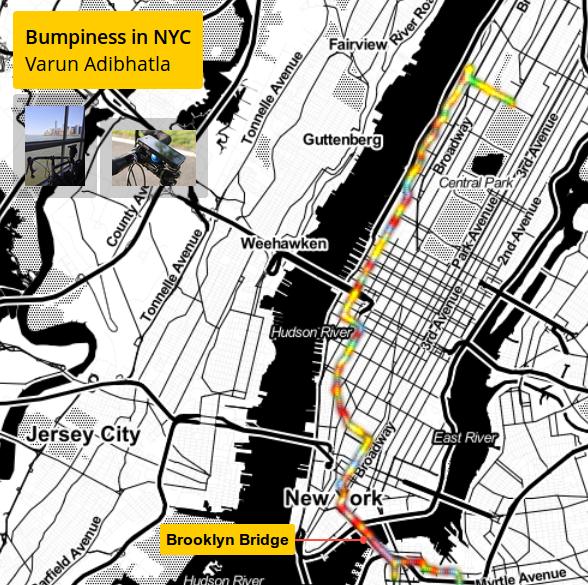
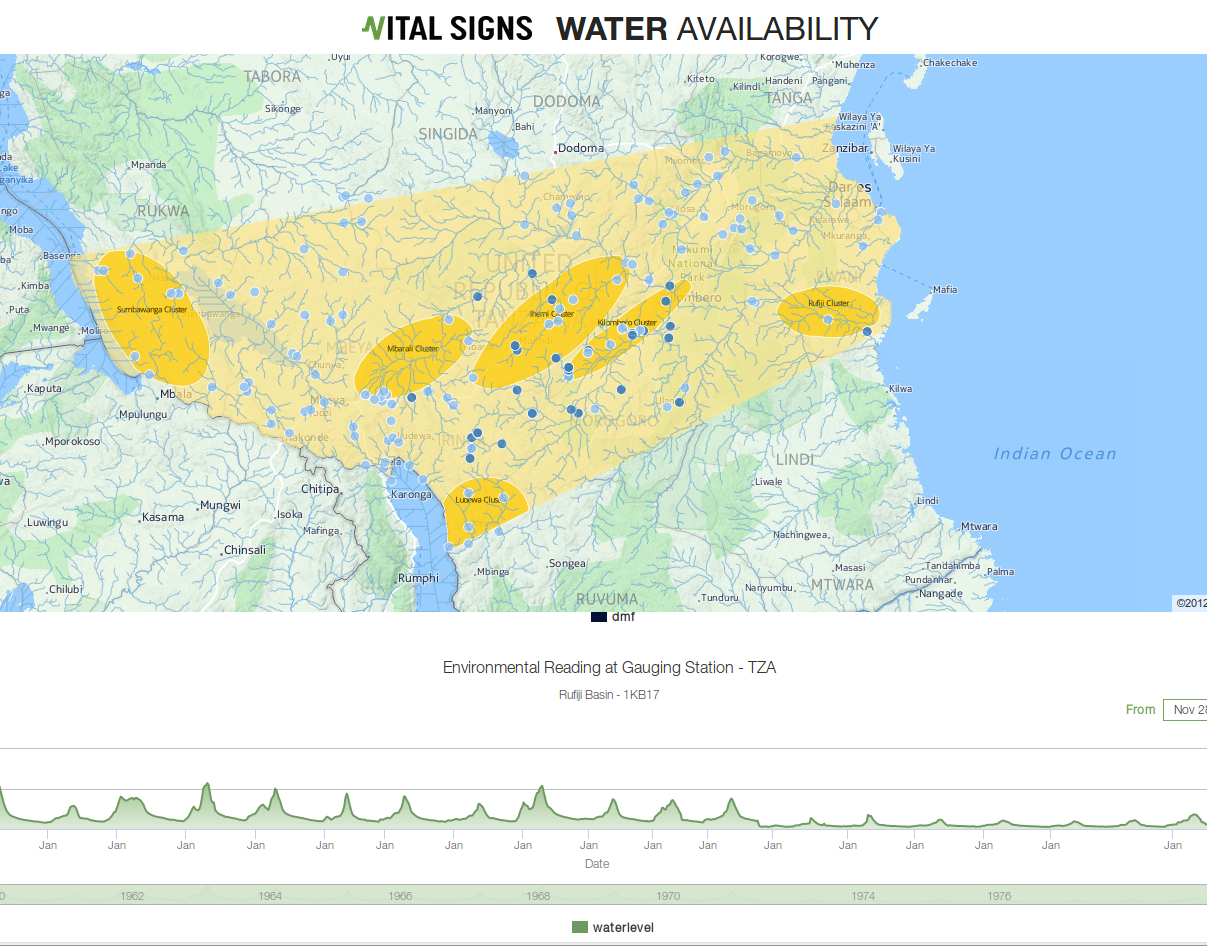
Who uses CartoDB?
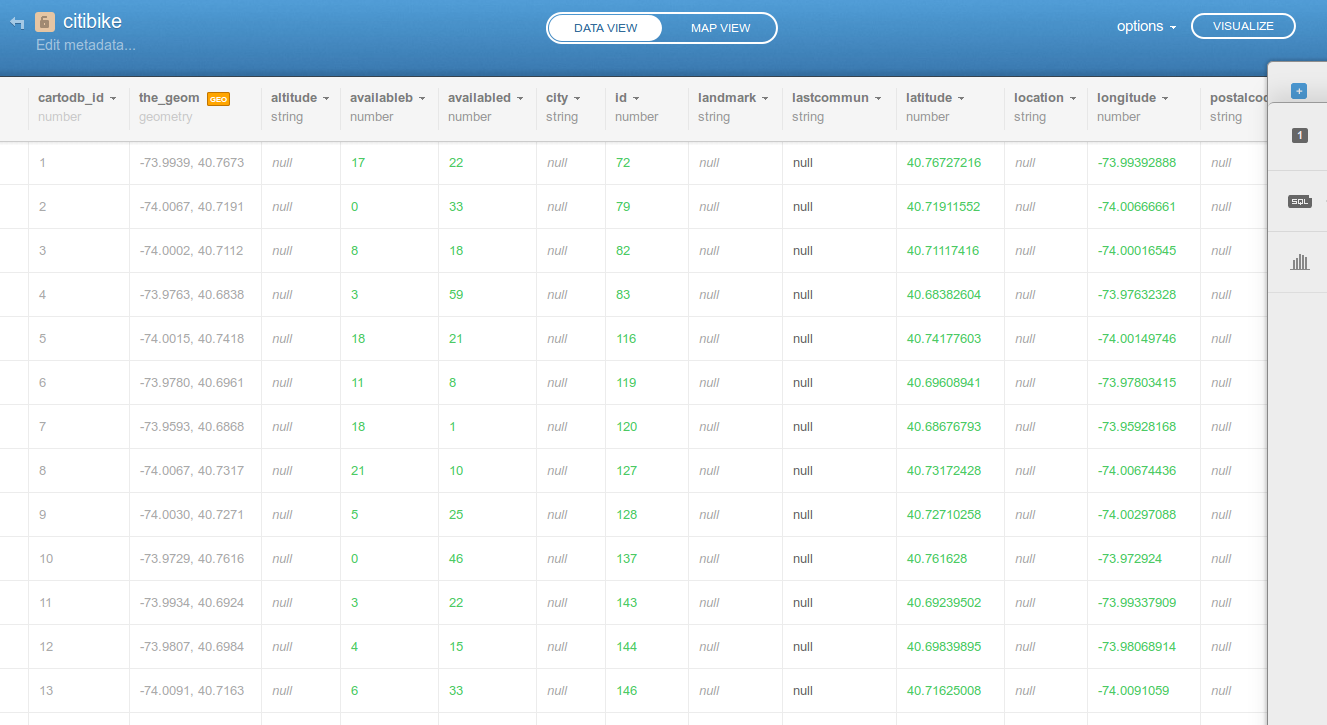
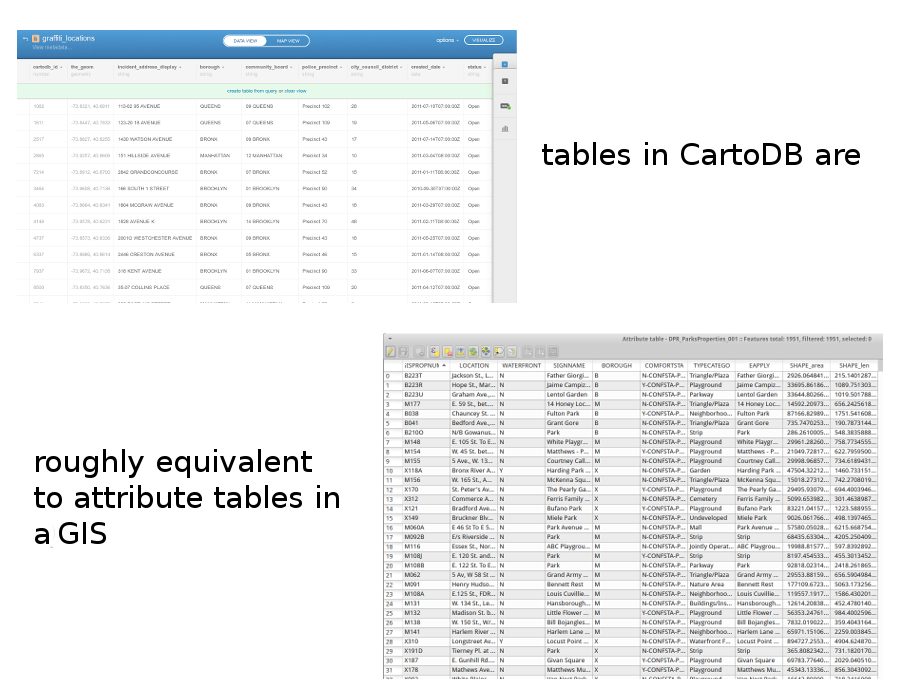
tables
where you import, edit, and analyze your data
you can upload:
- csv
- shapefiles (zipped)
- kml
- geojson
- (and some others)
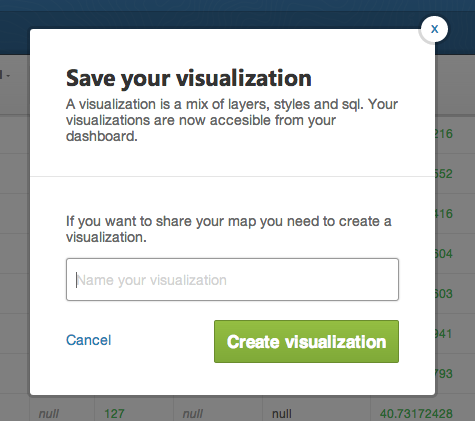
visualizations
where you make public map views of your tables
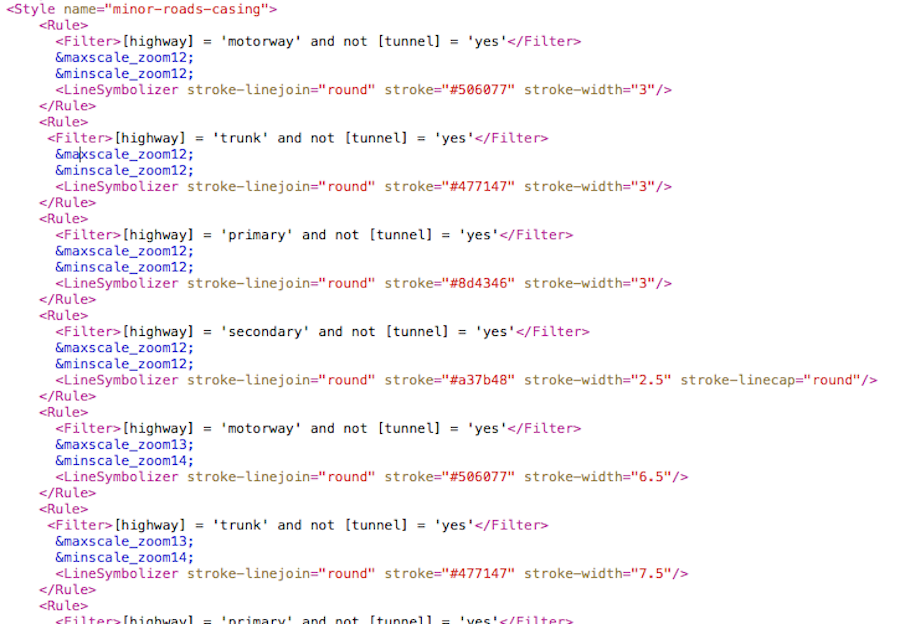
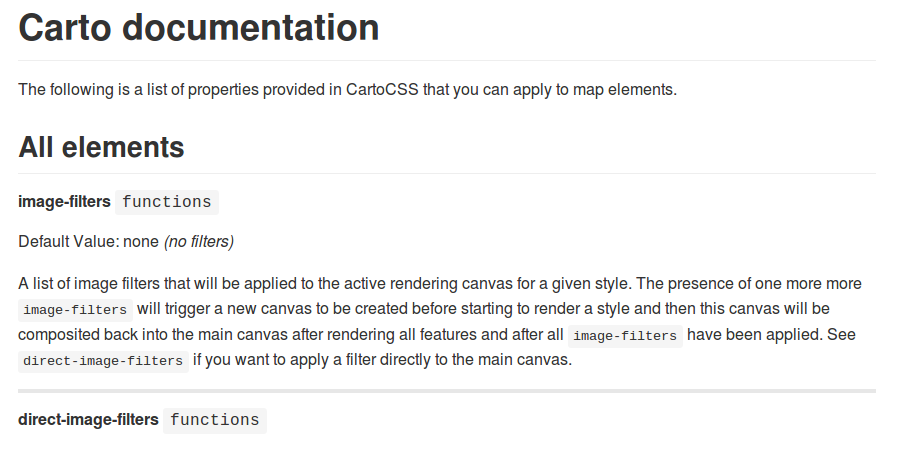
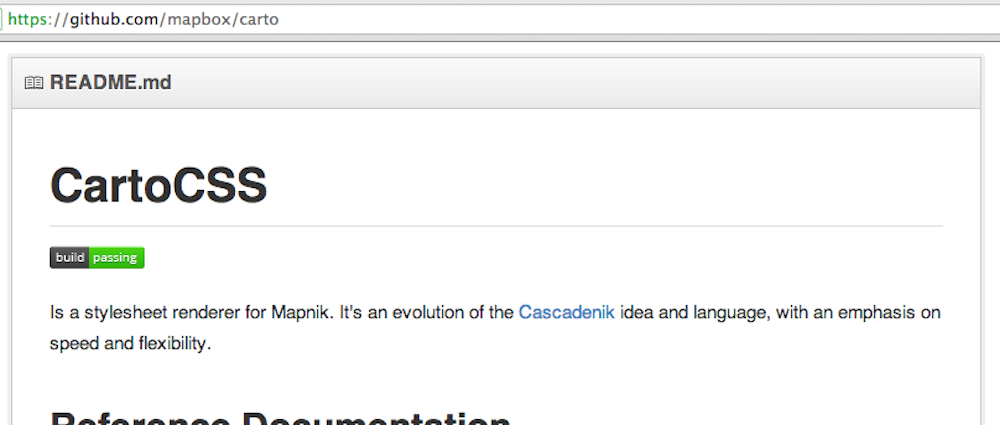
CartoCSS
why?
styling maps can be painful
you can share it
you can share it
(it's just text)
CartoCSS
#earthquakes {
    marker-fill: #ff307a;
    marker-line-color: #FFF;
    marker-line-width: 0.25;
    marker-line-opacity: 0.4;
    marker-width: 2;
    marker-allow-overlap: true;
}
this is a statement
this is a statement
#earthquakes {
    marker-fill: #ff307a;
    marker-line-color: #FFF;
    marker-line-width: 0.25;
    marker-line-opacity: 0.4;
    marker-width: 2;
    marker-allow-overlap: true;
}
statements start with a selector
statements start with a selector
#earthquakes
statements start with a selector
#earthquakes
"this statement will talk about the table called earthquakes"
always put a { after the selector
always put a { after the selector
#earthquakes {
and always always remember to close it with }
and always always remember to close it with }
#earthquakes {
}
and always always remember to close it with }
#earthquakes {
}
otherwise your statement will never end!
think of the { } as bookends
between { }, set your properties
what is a property?
#earthquakes {
    marker-fill: #ff307a;
}
#earthquakes {
    marker-fill: #ff307a;
}
always one per line, each line ending with a ;
#earthquakes {
    marker-fill: #ff307a;
    marker-line-color: #FFF;
}
#earthquakes {
    marker-fill: #ff307a;
    marker-line-color: #FFF;
}
the property name and the value you're setting it to are separated by a :
property values will often be color strings, numbers, or true/false
#earthquakes {
    marker-fill: #ff307a;
    marker-line-color: #FFF;
    marker-line-width: 0.25;
    marker-line-opacity: 0.4;
    marker-width: 2;
    marker-allow-overlap: true;
}
use the visualization wizard to give your markers the Simple style, then:
- make the markers 5 pixels wide,
- outlined by a 2 pixel-wide line, and
- give the fill and stroke of the markers different colors
that's nice, but it gets more interesting
let's vary some properties by zoom level
#earthquakes {
    marker-width: 3;
    ...
    [zoom >= 10] {
        marker-width: 8;
    }
}
let's call these conditional statements
conditional statements are only used if some condition is met
#earthquakes {
    marker-width: 3;
    ...
    [zoom >= 10] {
        marker-width: 8;
    }
}
"make the earthquakes markers 3 pixels wide. if the map is at zoom level 10 or higher, make the earthquakes markers 8 pixels wide."
#earthquakes {
    marker-width: 3;
    ...
    [zoom >= 10] {
        marker-width: 8;
    }
    [zoom >= 16] {
        marker-width: 13;
    }
}
make your markers double in width at zoom level 12 and above
make your markers half their width below zoom level 8
that's not all!
you can change styles based on a feature's attributes
#earthquakes {
    marker-width: 3;
    ...
    [mag >= 6.5] {
        marker-width: 8;
    }
}
look familiar?
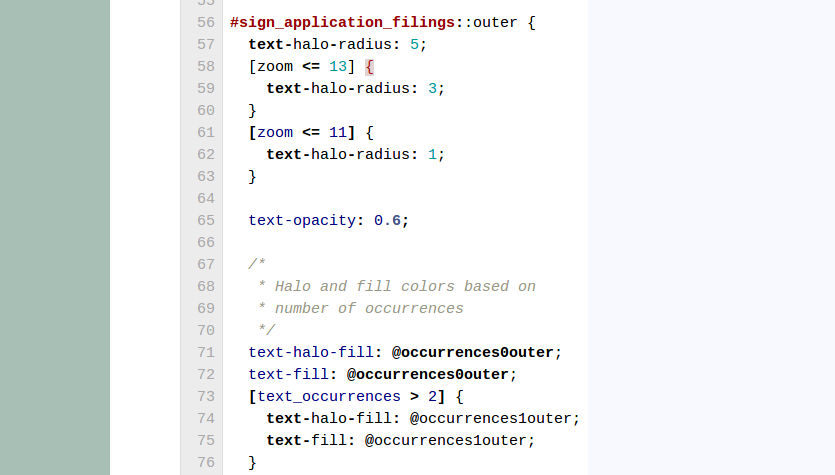
conditional statements on text need to wrap those strings in quotation marks
#earthquakes {
    marker-width: 3;
    ...
    [place = 'Northern Mid-Atlantic Ridge'] {
        marker-width: 8;
    }
}
make your markers a different color when the magnitude is over 7
you don't have to memorize all of this
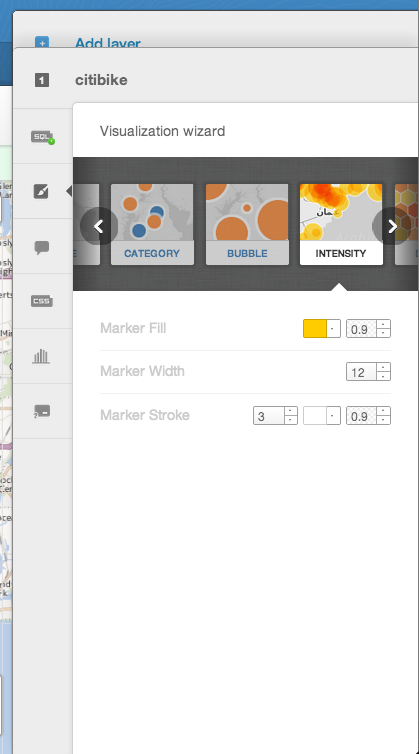
experiment with CartoDB's visualization wizards, see the code they produce
read other people's CartoCSS
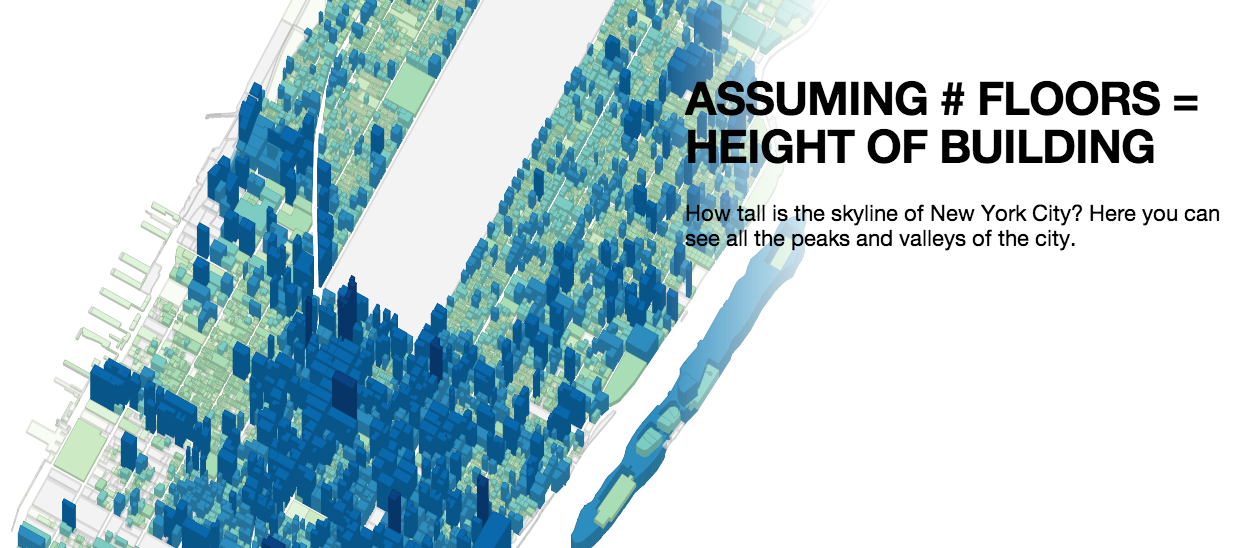 pluto maps in CartoDB