Welcome to Advanced GIS, Lecture 4
This is a web page that can be viewed as slides.
→ to move forward
← to go back
no class 2/26
3/5 guest speaker
readings in assignment
CartoCSS recap
#airbnb {
    marker-width: 3;
    ...
    [zoom >= 10][zoom < 16] {
        marker-width: 8;
    }
}
#airbnb {
    marker-width: 3;
    ...
    [neighbourhood = 'Bedford-Stuyvesant'],
    [neighbourhood = 'Bushwick'] {
        marker-width: 8;
    }
}
@width: 8;
#airbnb {
    marker-width: @width;
    marker-fill: #ff307a;
    marker-allow-overlap: true;

    [zoom >= 4] {
        marker-width: @width * 2;
    }
    [zoom >= 8] {
        marker-width: @width * 3;
    }
    [zoom >= 12] {
        marker-width: @width * 4;
    }
}
CartoDB follow up
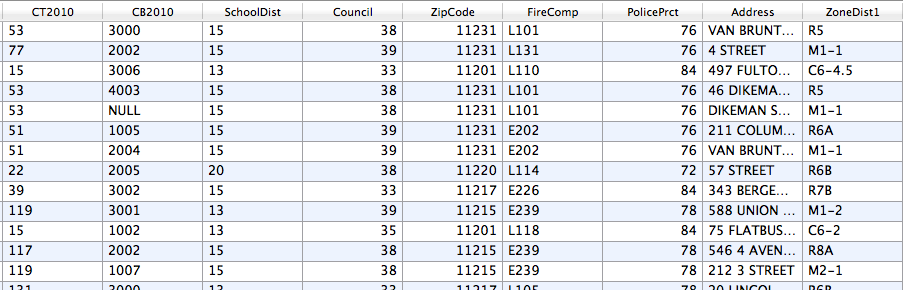
adding features
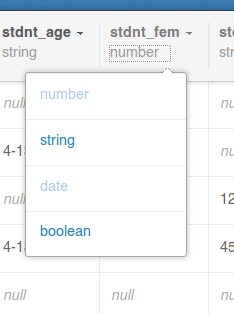
adding columns
useful if you want to add data to your features
or, say, you have one thing in the table but want to display another
advanced legend and infowindow stuff
advanced legend and infowindow stuff
you need HTML and CSS. we'll get there.
but I wanted 6.5!
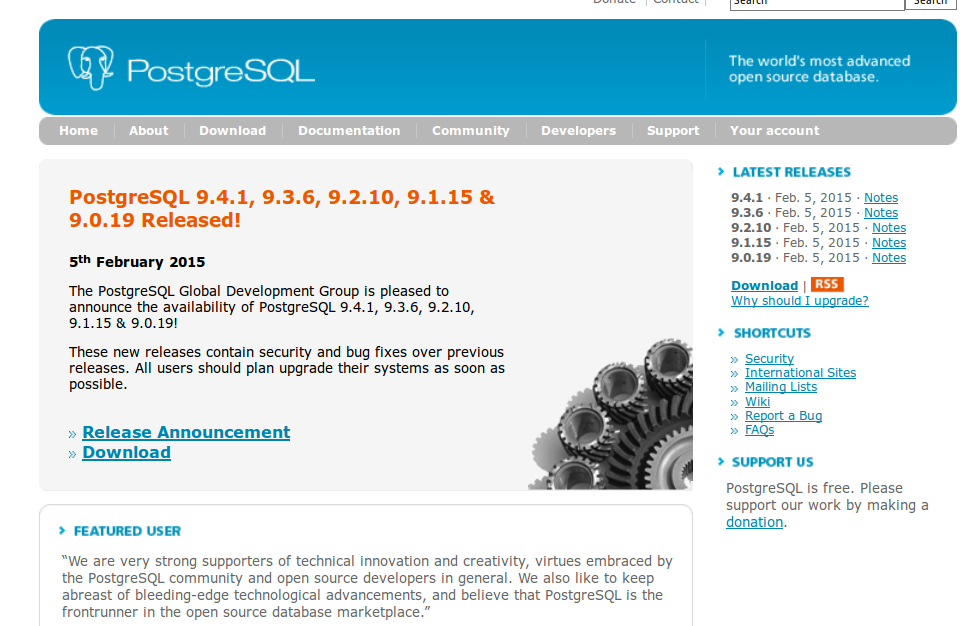
SQL
SQL
Structured Query Language
SQL
the language databases understand
you'll use SQL in two ways:
1. pulling data out of the database
2. changing the data in the database
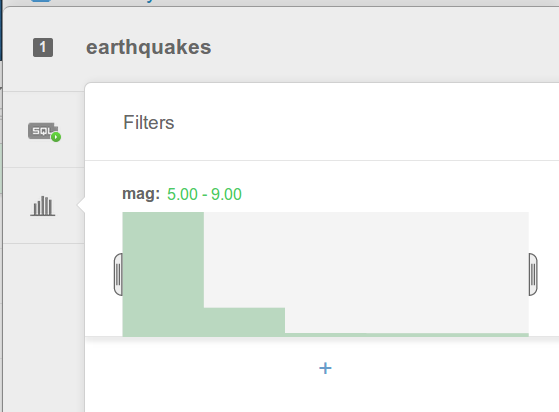
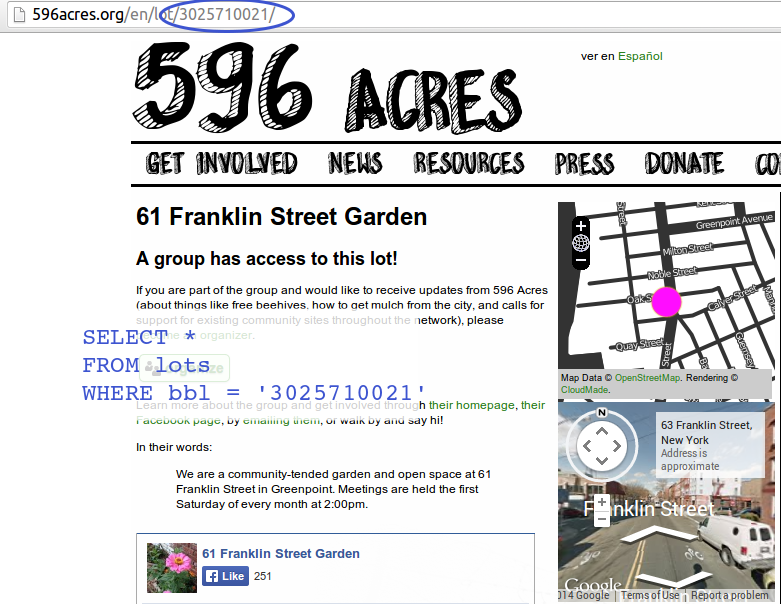
Give me the pages that refer to properties in Brooklyn.
Give me the addresses of the properties in Brooklyn.
Give me the addresses of the properties in Brooklyn that have been built on since 1950.
databases are great at these types of questions
it's what they were made for
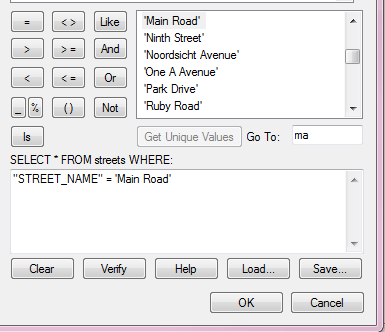
SQL helps you ask these questions in a way databases understand
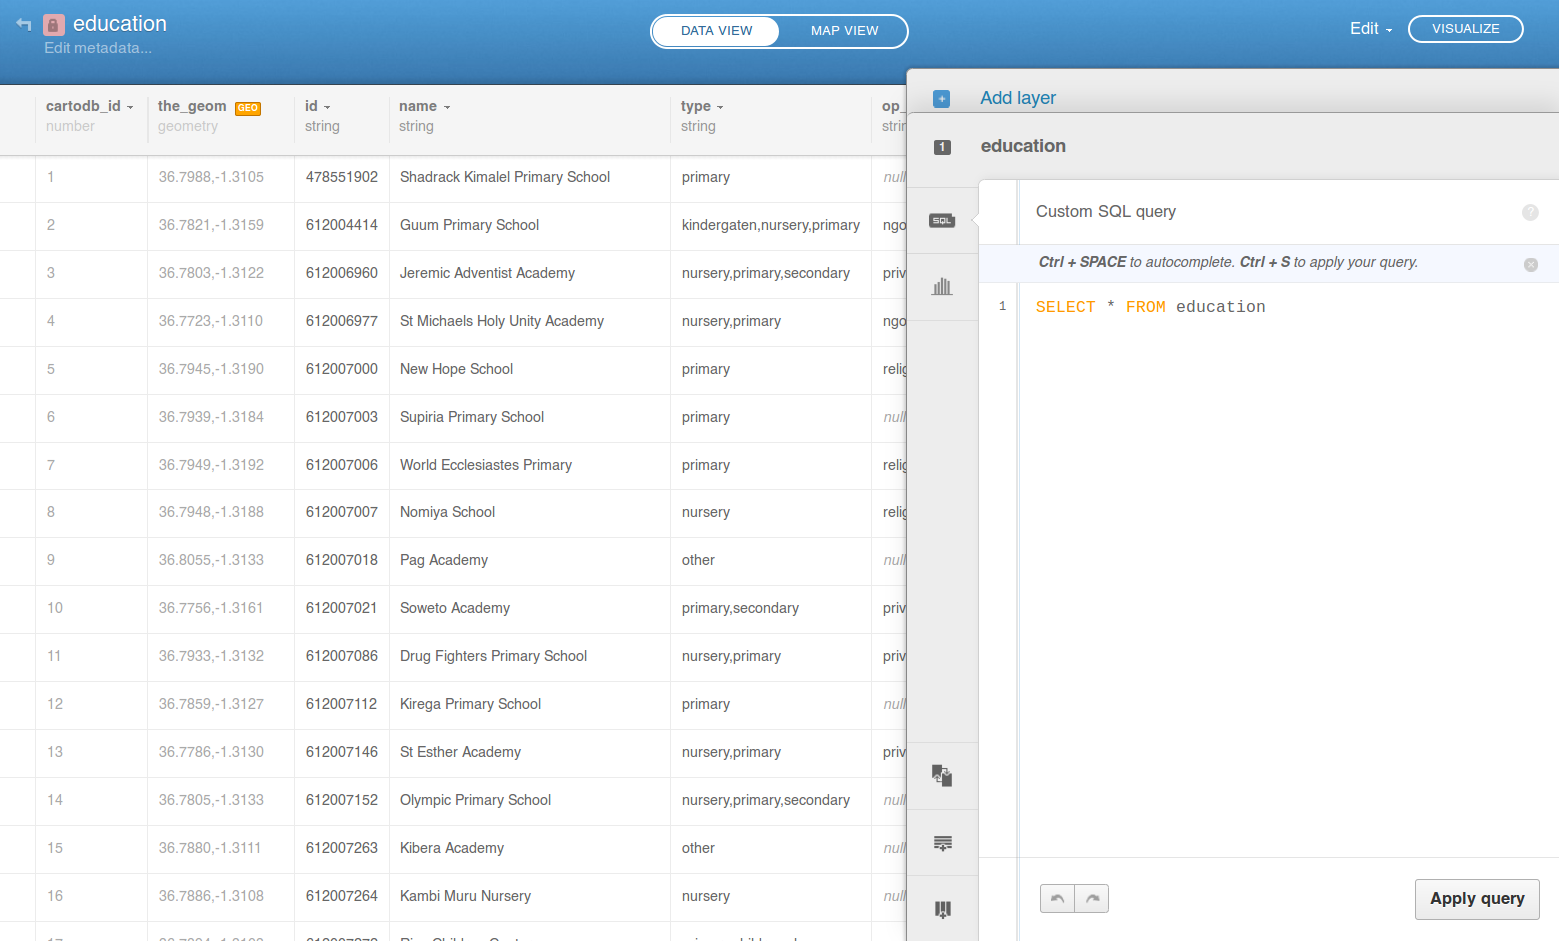
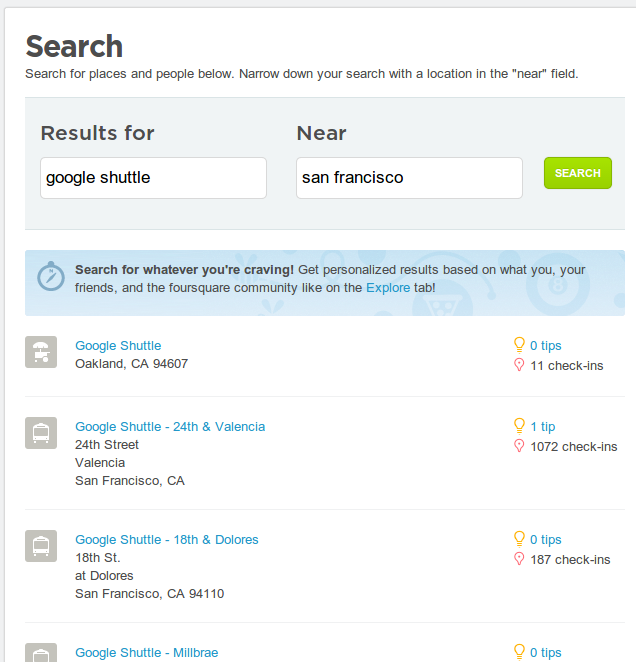
CartoDB
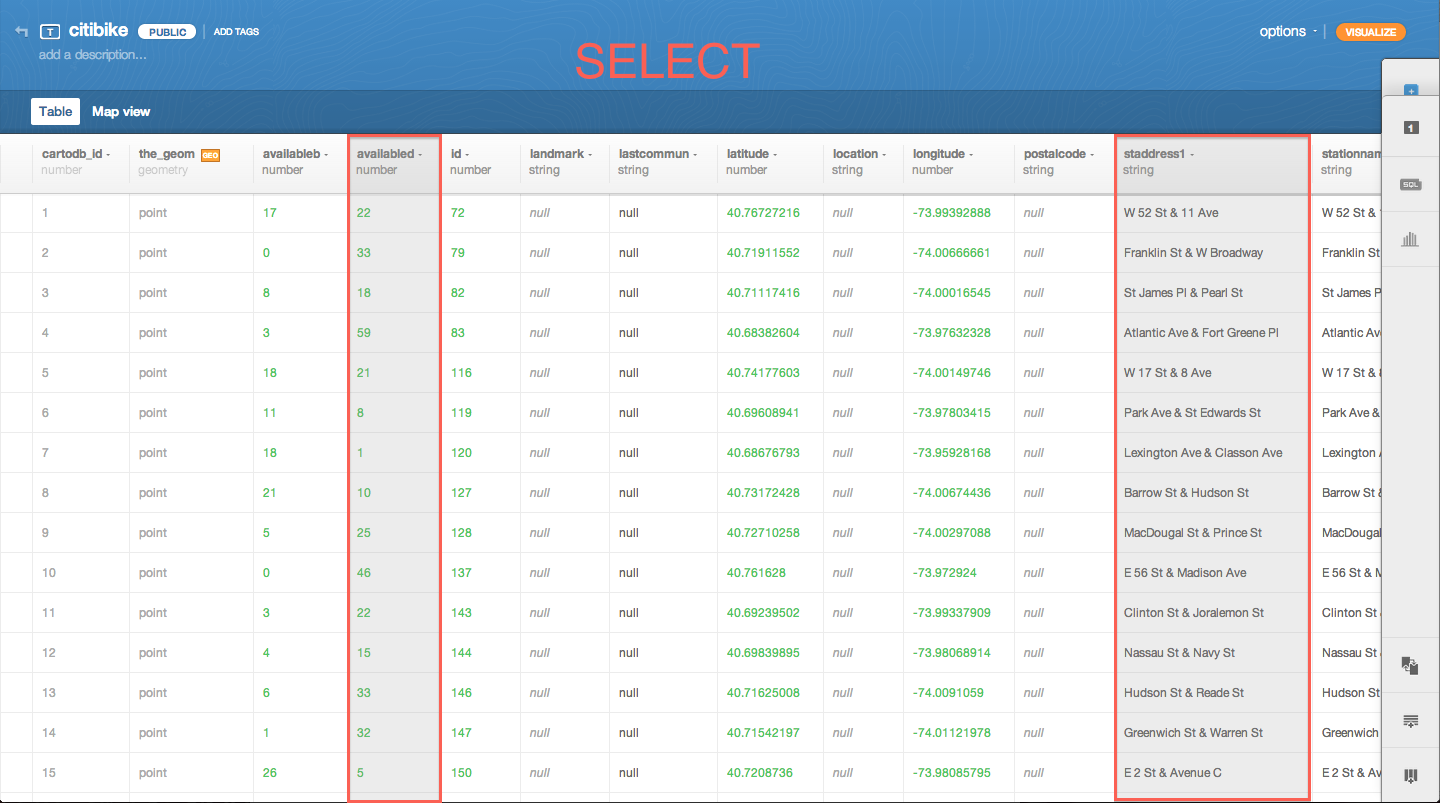
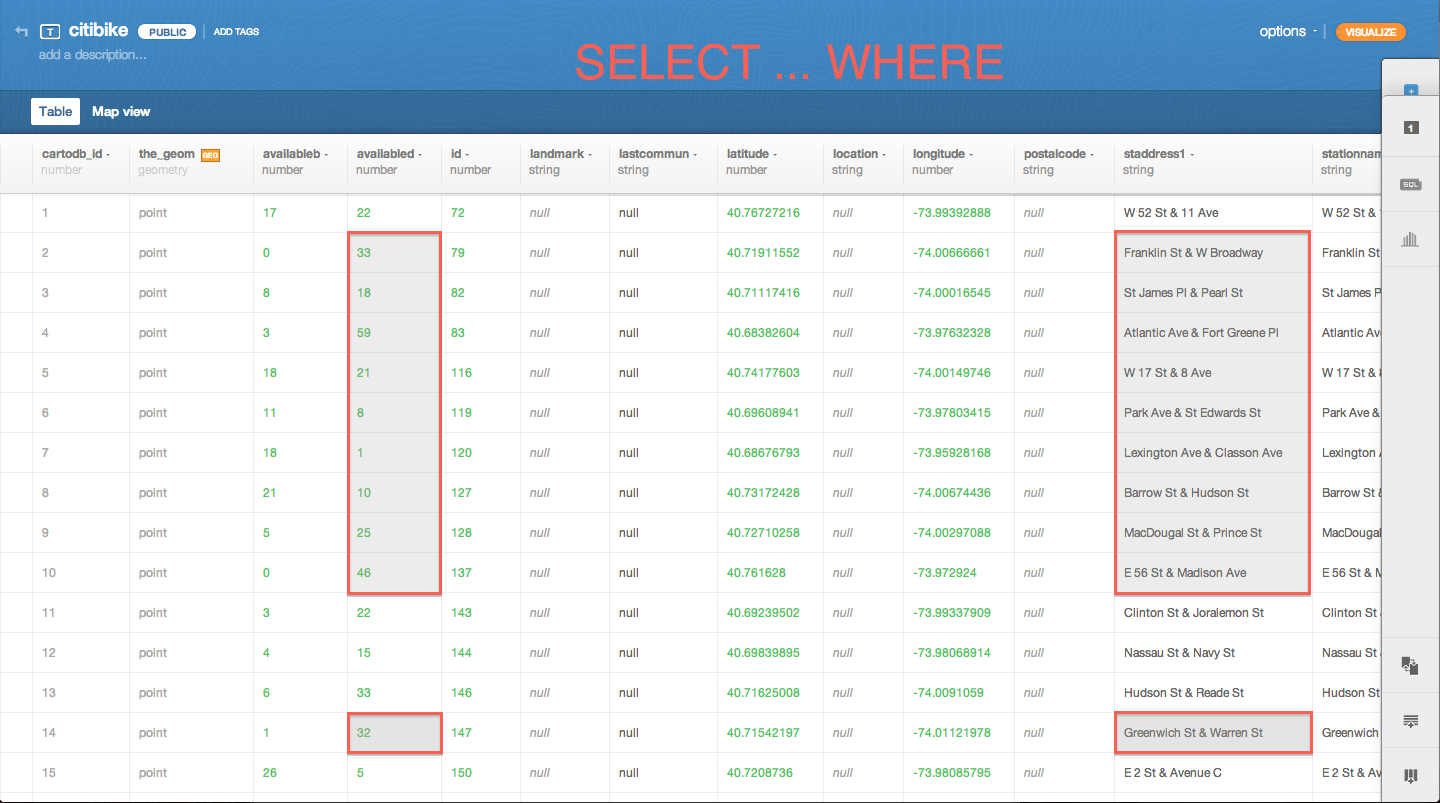
SELECT: choose columns from a table
just list the columns. for example:
SELECT students, teachers
FROM education
SELECT *: choose all columns
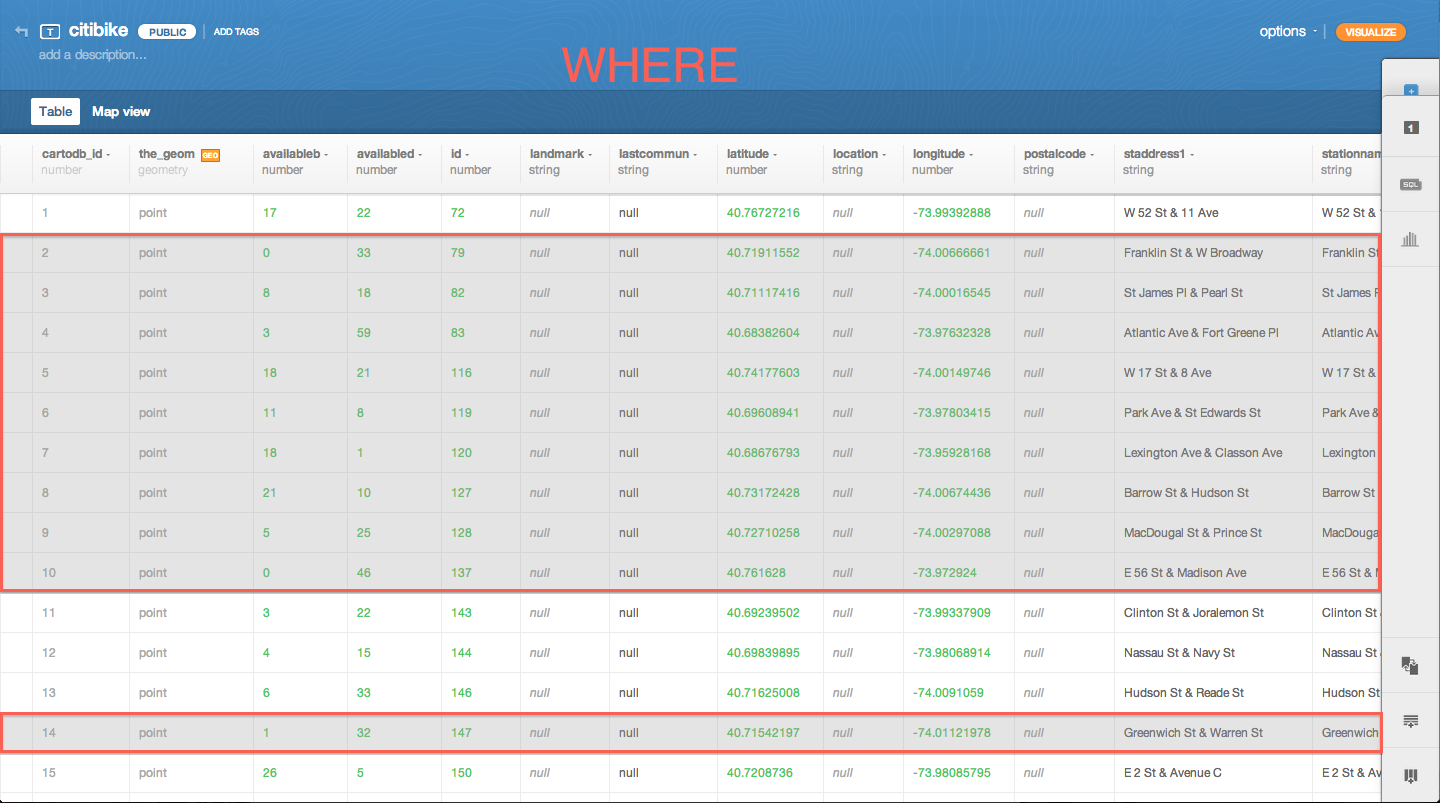
WHERE: choose rows from a table
these conditions are the same as the ones in CartoCSS:
>
<
=
!=
>=
<=
for example:
SELECT *
FROM education
WHERE students > 100
and you combine them with AND / OR
for example:
SELECT *
FROM education
WHERE students > 100
    AND students < 200
try it yourself
get just the education with students between 100 and 150
or you can negate a condition with NOT
for example:
SELECT *
FROM education
WHERE NOT (students > 100
  OR op_type = 'religious')
try it yourself
get just the education features with students not between 100 and 150
SELECT does not change the table, it only changes your view of the table
you can also use SELECT to get a better idea of what data is in your table
count matching rows:
SELECT COUNT(*)
FROM education
WHERE students > 100
  OR op_type = 'religious'
but you'll almost never want to use this statement for your map
try it yourself
get the number of education features with students between 100 and 150
SELECT trick: add "columns" to your selection
SELECT *, 5
FROM education
SELECT *, stdnt_fem / students
FROM education
SELECT *,
    (stdnt_fem / students) * 100
FROM education
SELECT *,
    (stdnt_fem / students) * 100
    AS stdnt_fem_per
FROM education
1. pulling data out of the database
2. changing the data in the database
you can also use SQL to quickly UPDATE or DELETE the data in your table
these will destroy data, so have a backup or test it with a table you don't need
this is one way to customize the way data is displayed in your infowindow
first, create a new column on your table
then put the desired data in that column, based on some condition
UPDATE education
SET size = 'large'
WHERE students > 2500
DELETE FROM education
WHERE ...
more in the SQL reference
SQL shows up everywhere online
that's a lot, but there's a little more
SELECT *,
    (stdnt_fem / students) * 100
    AS stdnt_fem_per
FROM education
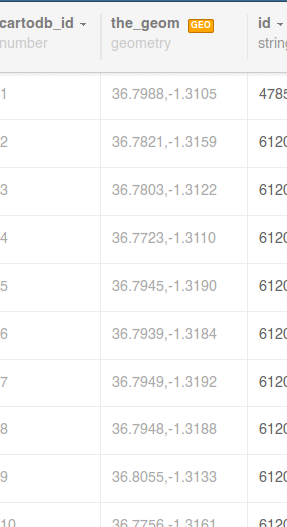
SELECT *, ST_area(the_geom)
FROM kiberaboundary
SELECT *,
  ST_area(ST_transform(the_geom_webmercator, 21036))
FROM kiberaboundary
SELECT education.*
FROM education, kiberaboundary
WHERE
  kiberaboundary.name = 'Silanga' AND
  ST_within(education.the_geom, kiberaboundary.the_geom)
open data
open data
data that is:
- accessible (online, in a widely-used format)
open data
data that is:
- accessible (online, in a widely-used format)
- licensed freely
open data
data that is:
- accessible (online, in a widely-used format)
- licensed freely
- usually created by a large entity
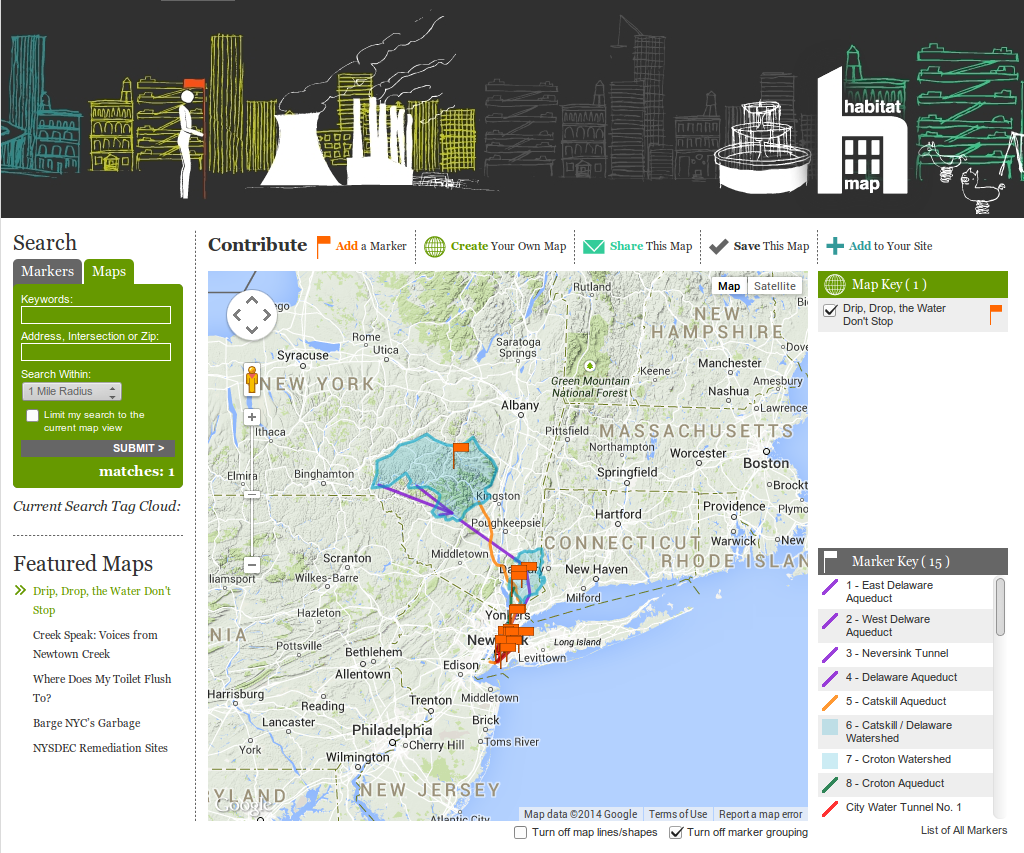
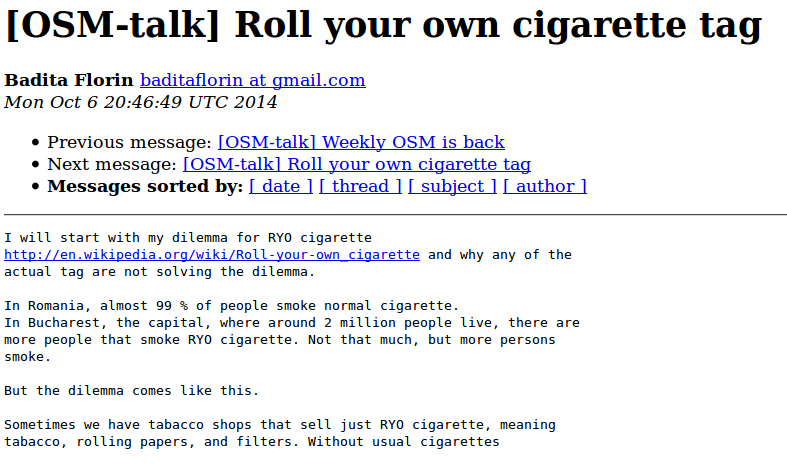
collaborative data
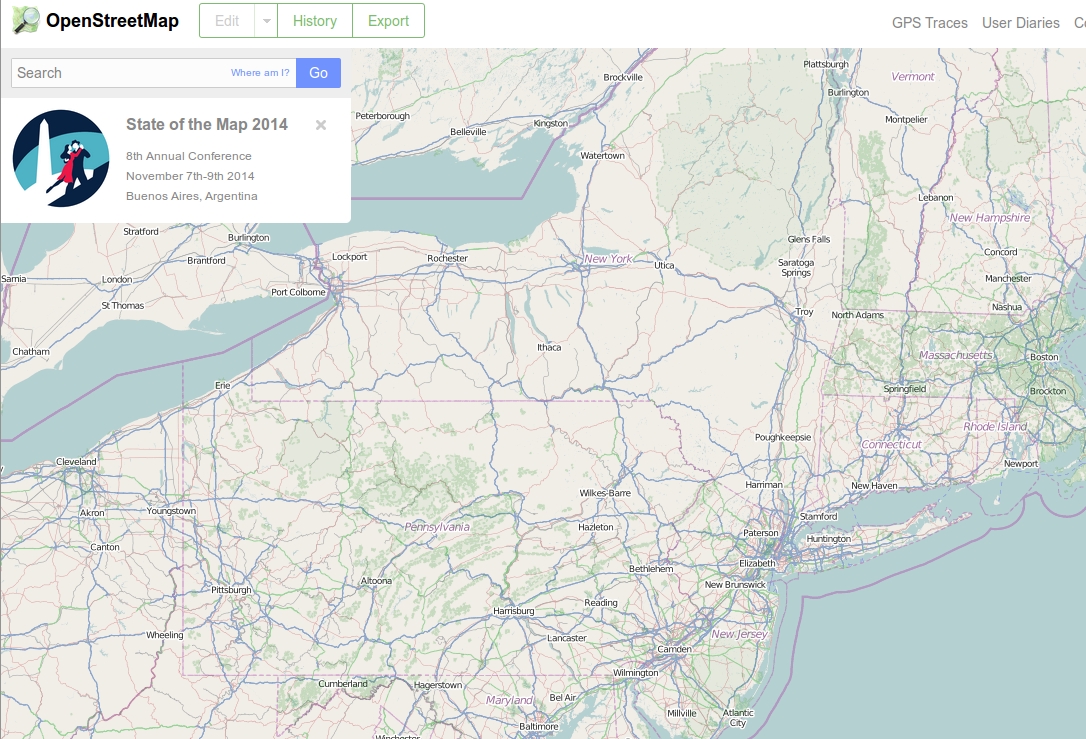
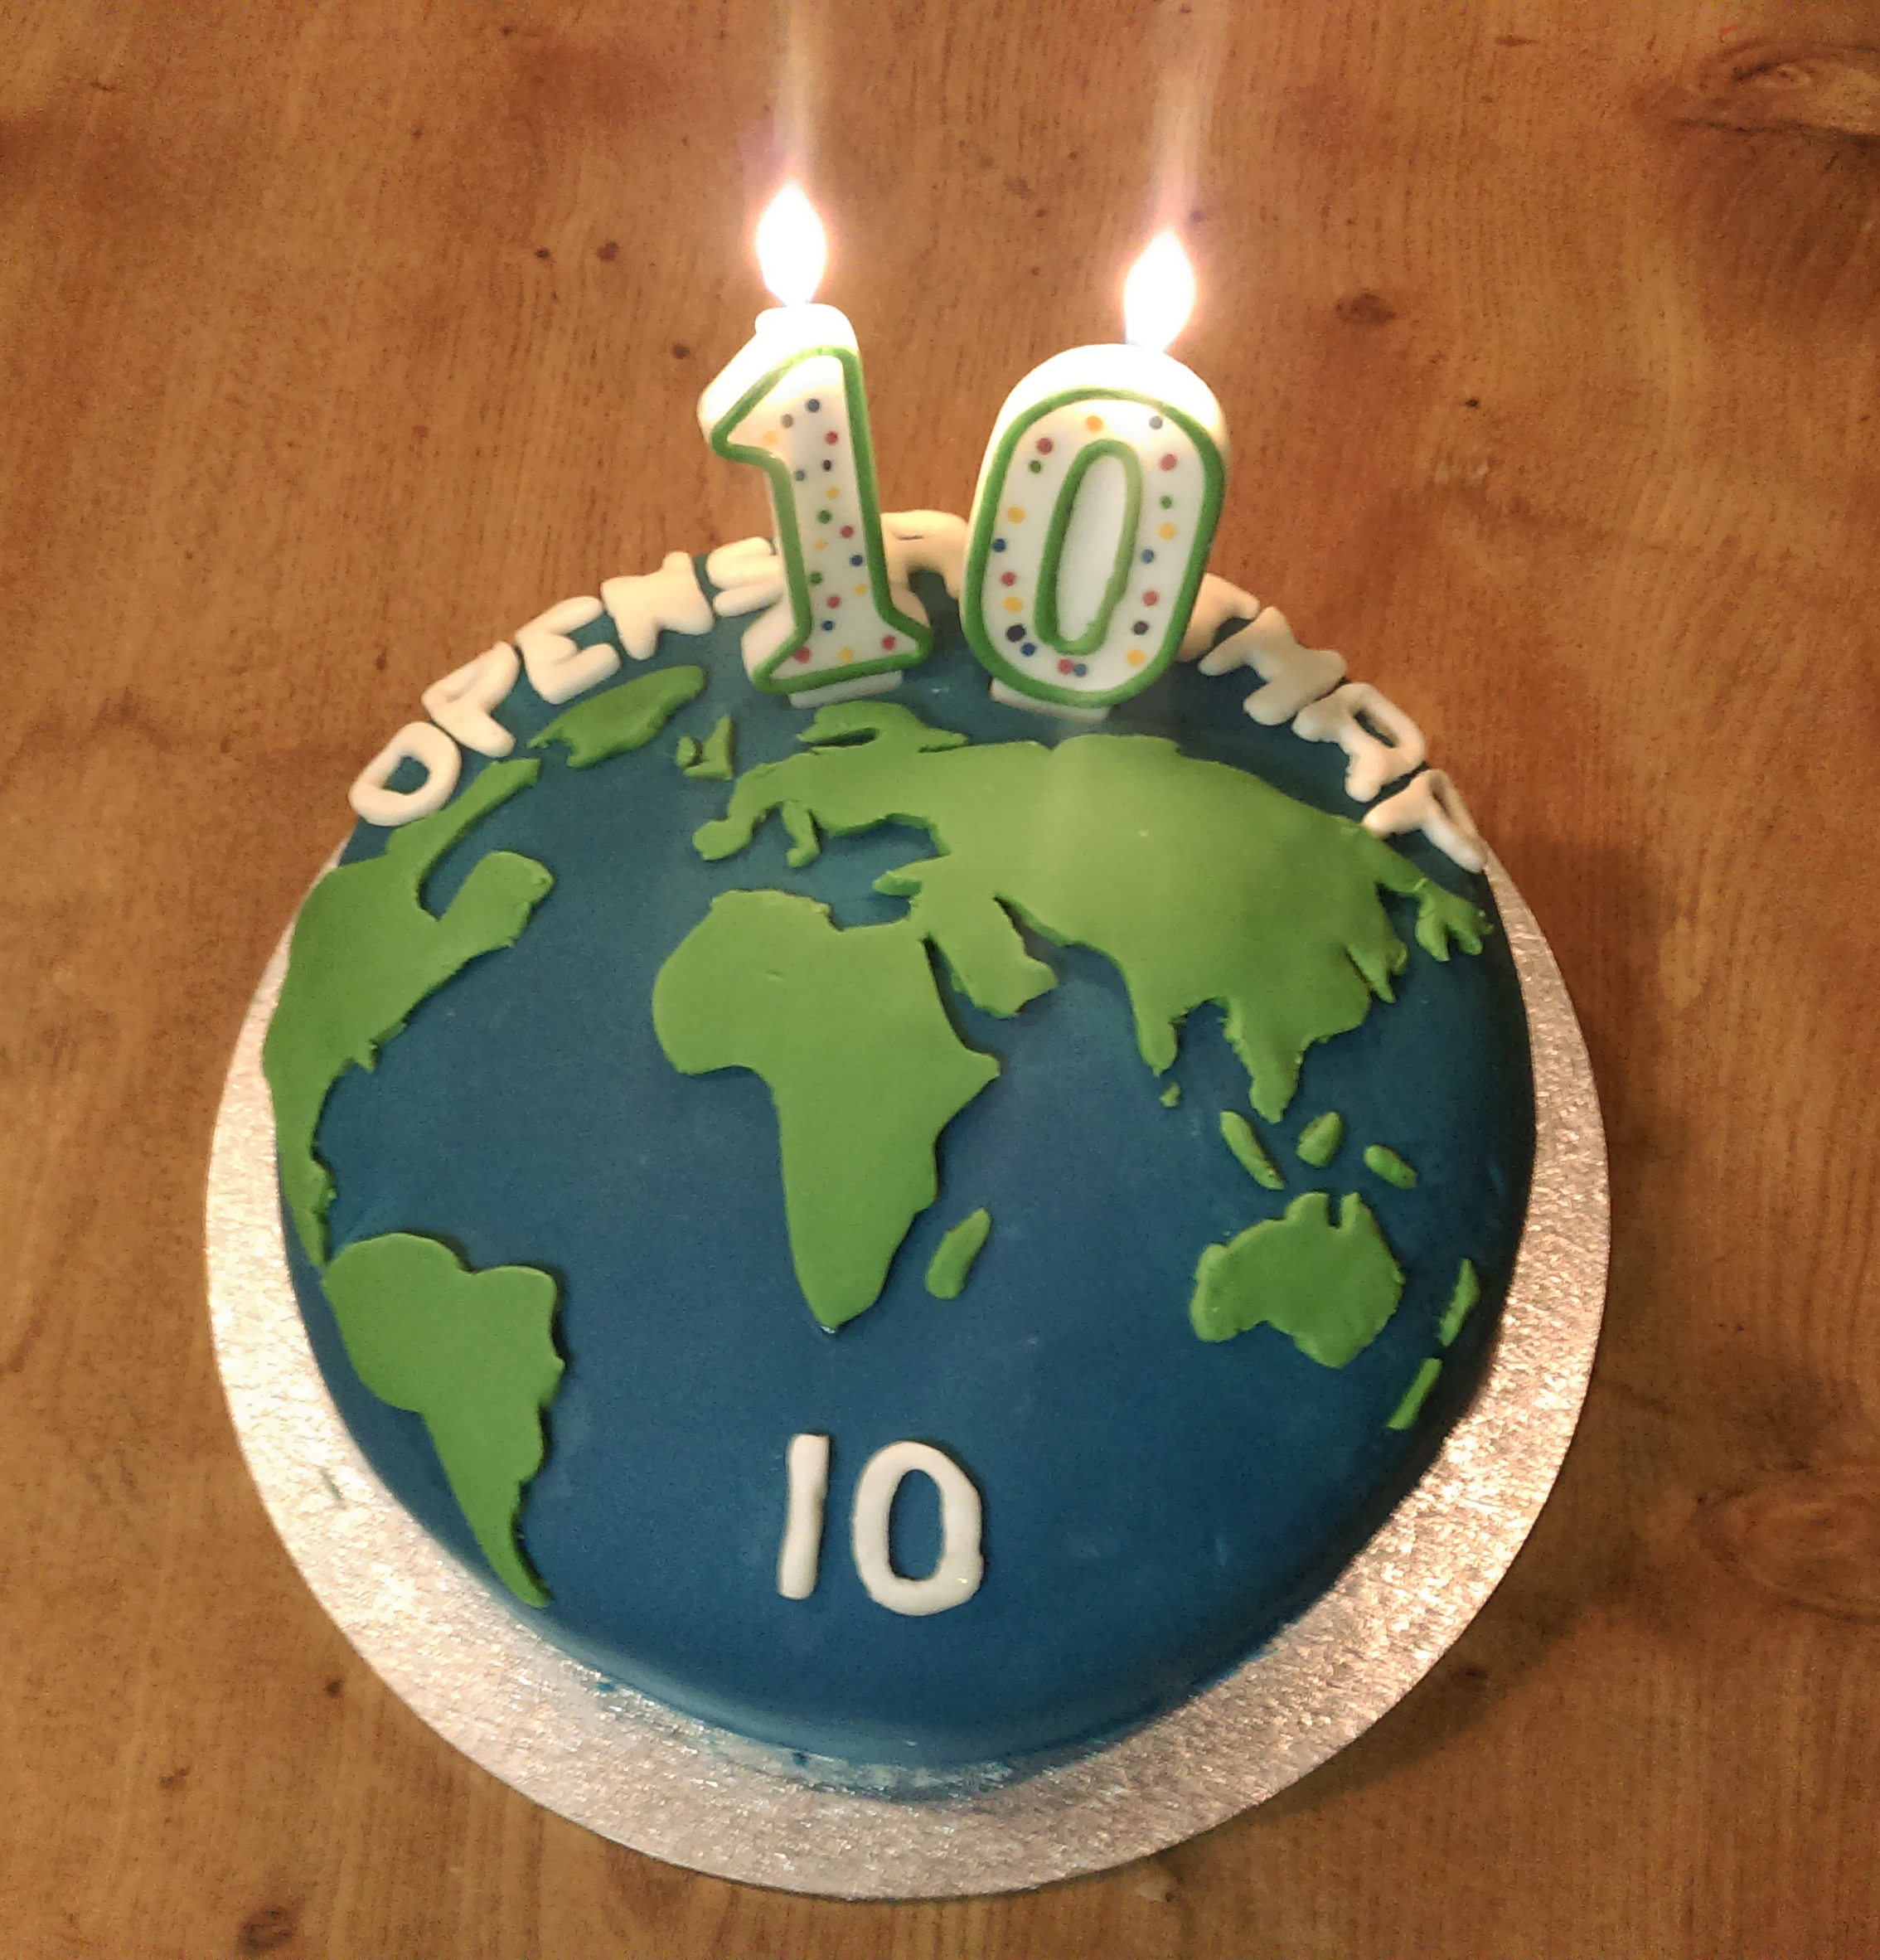
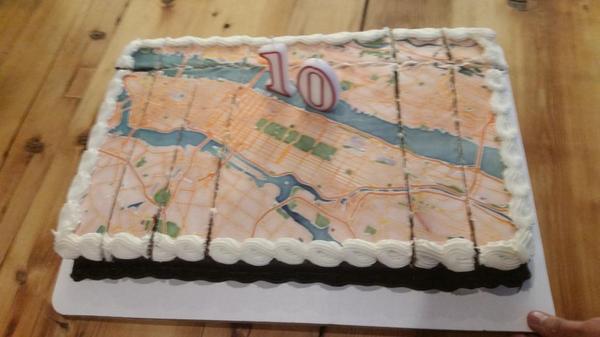
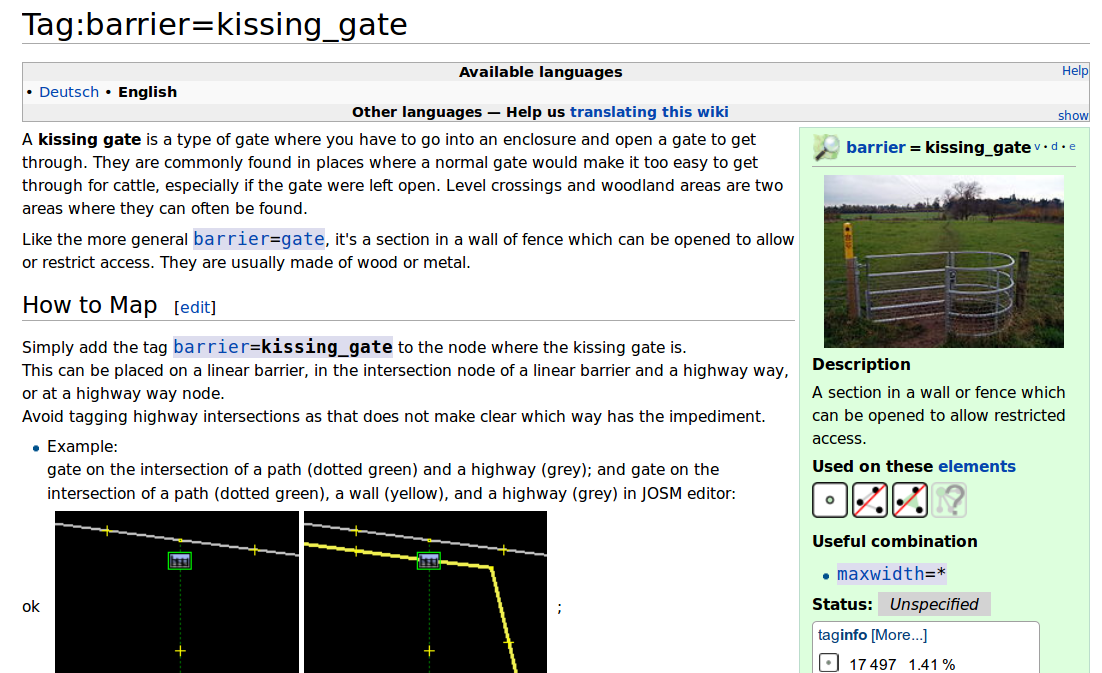
what is OpenStreetMap (OSM)?
"the free wiki map of the world"
started in 2004 in the UK
started in 2004 in the UK
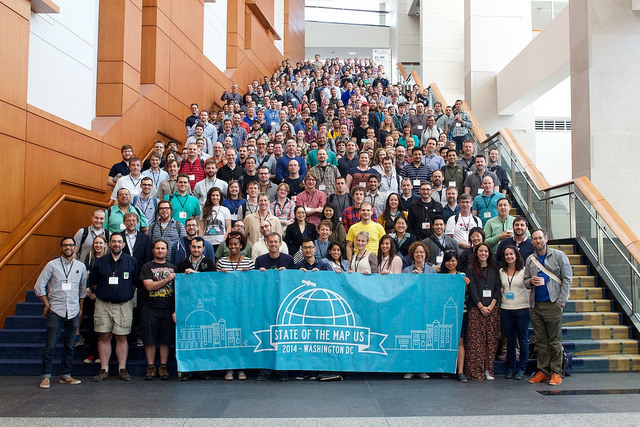
first State of the Map conference in 2007
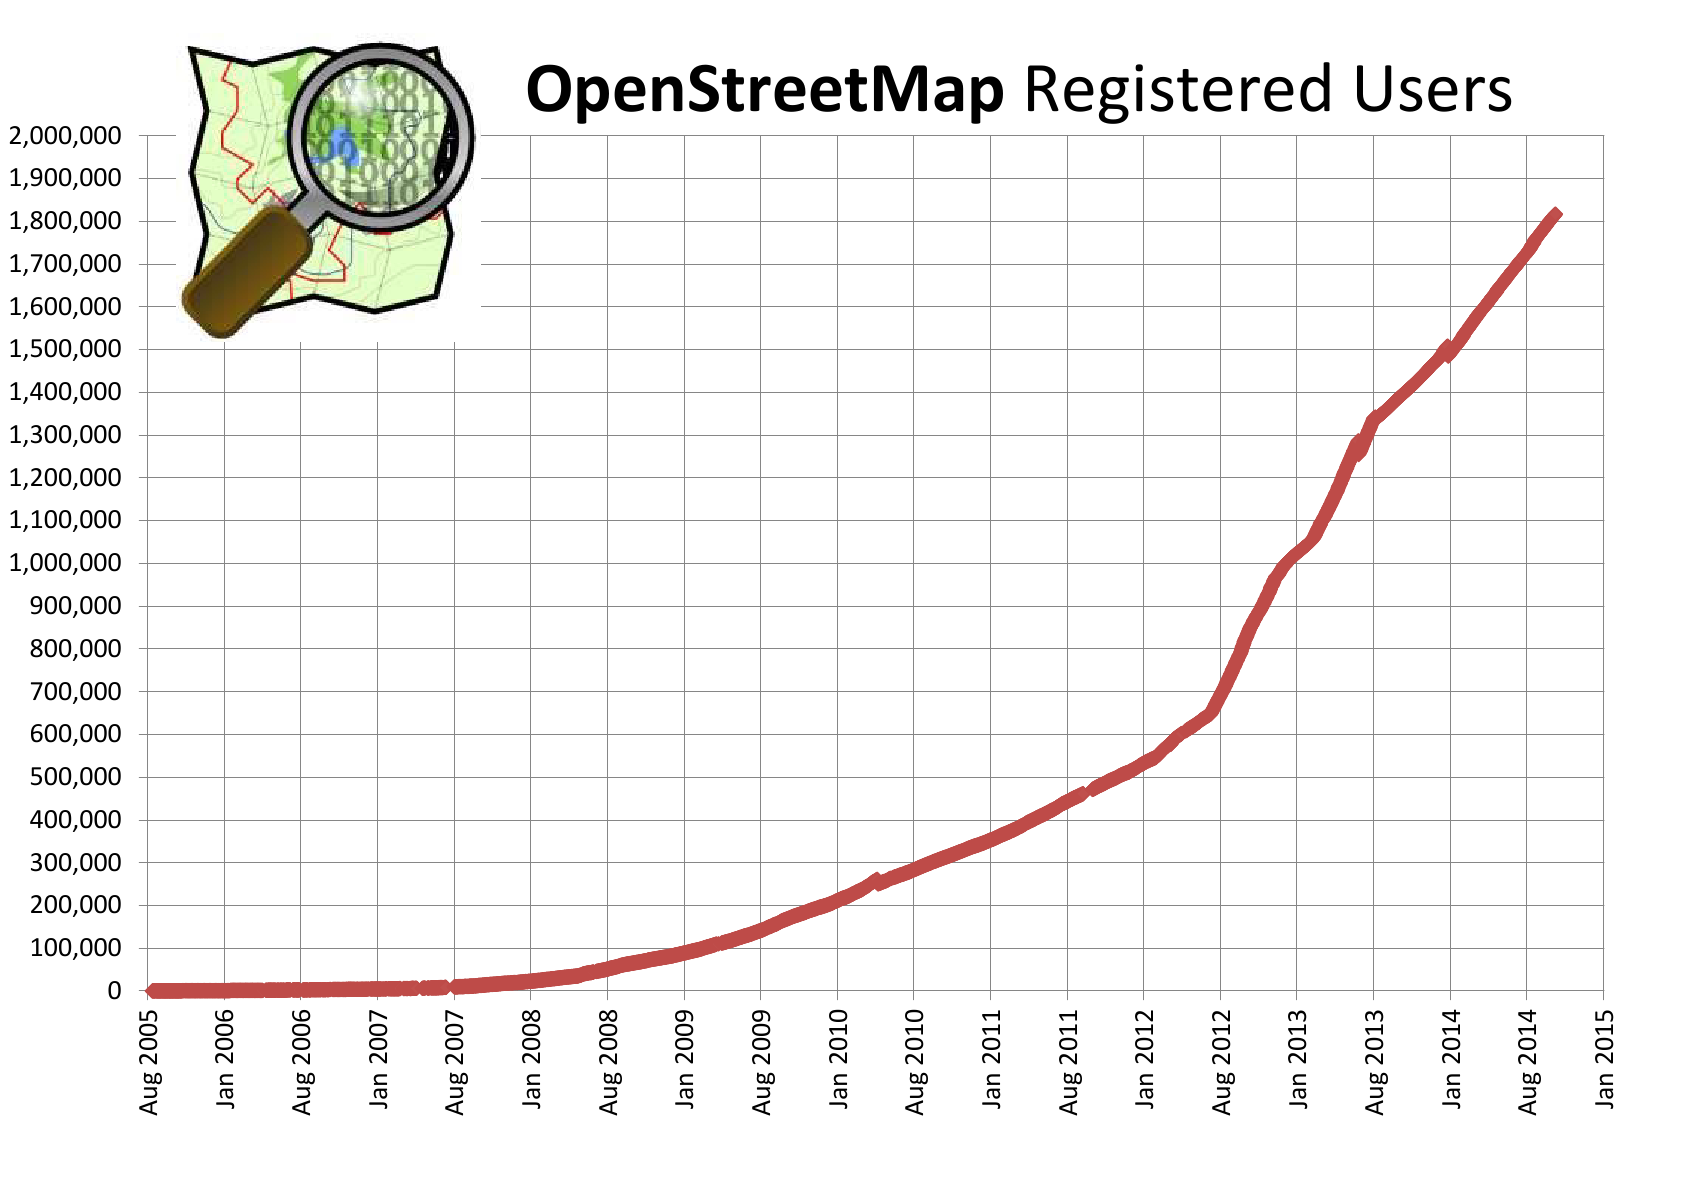
started in 2004 in the UK
first State of the Map conference in 2007
over 1 million registered users in 2013
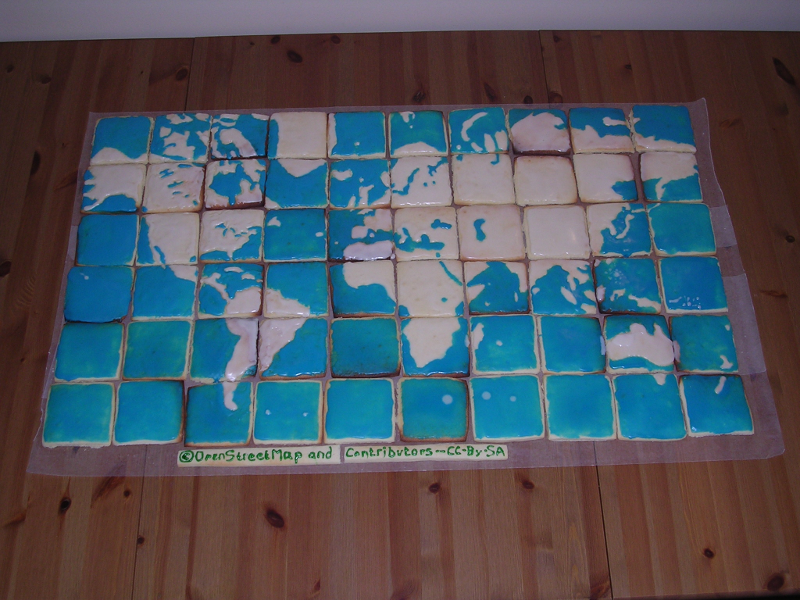
license
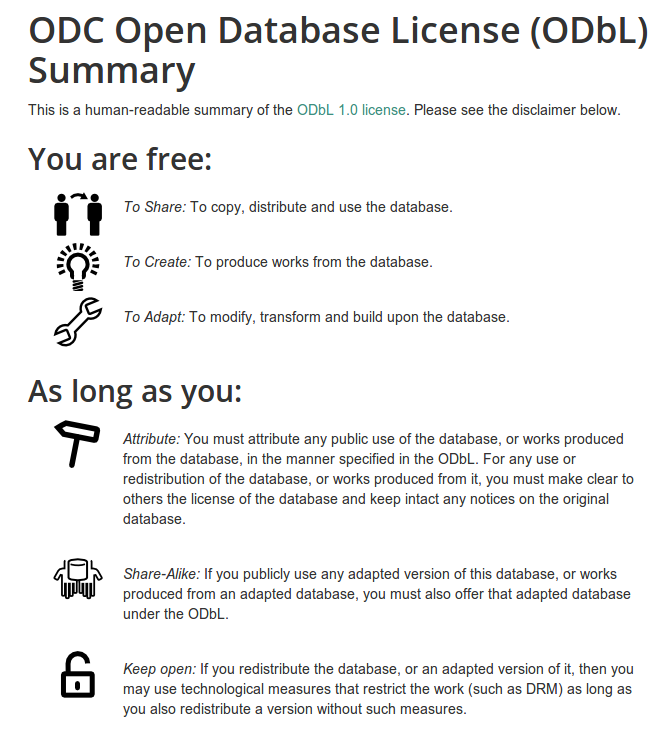
license
Open Database License (ODbL)
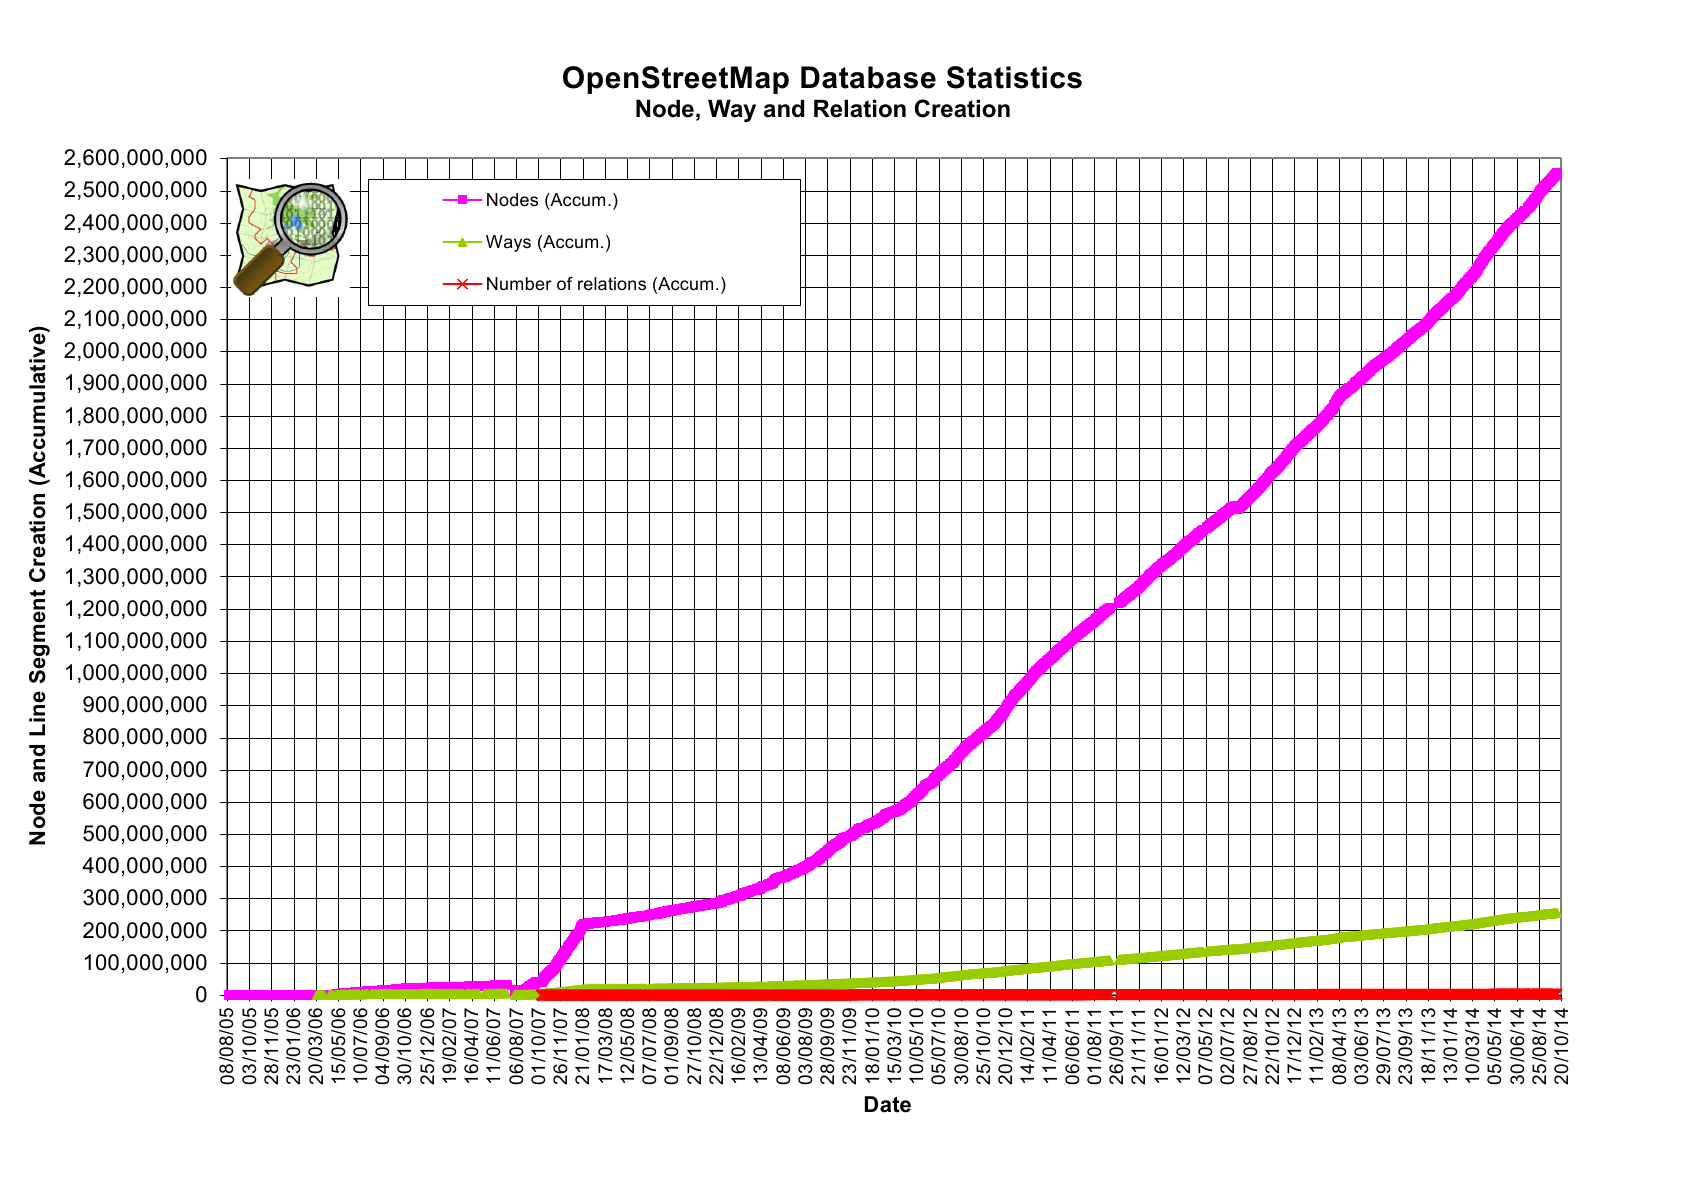
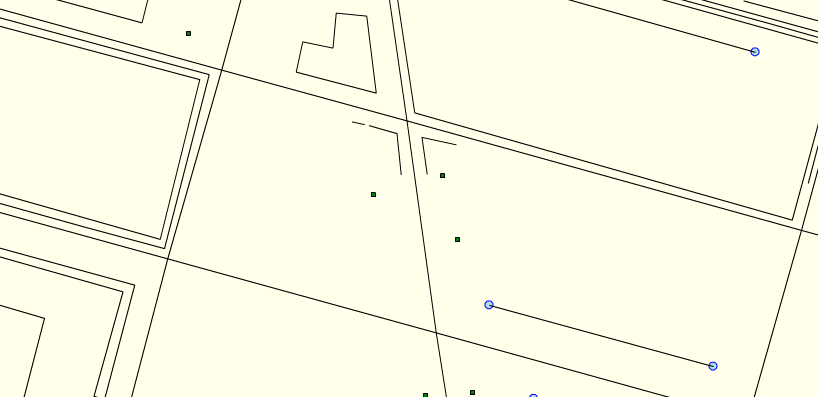
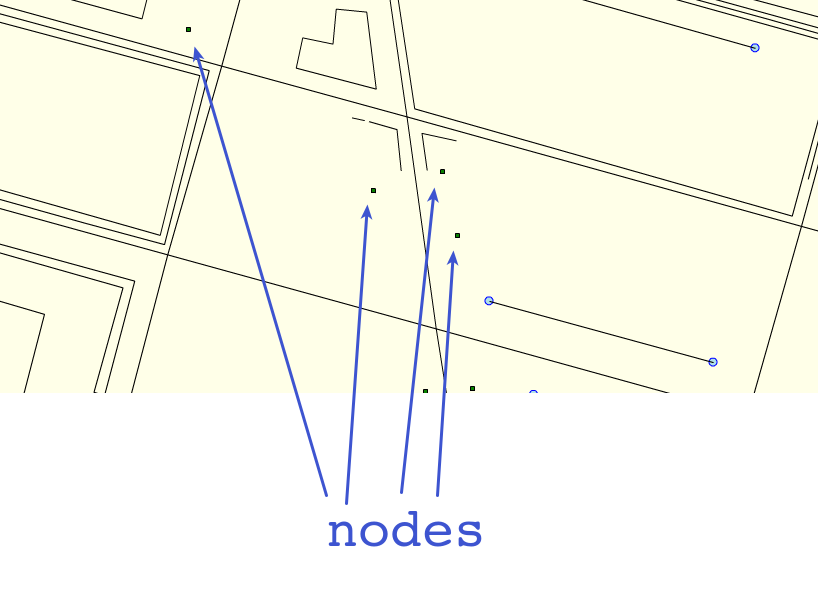
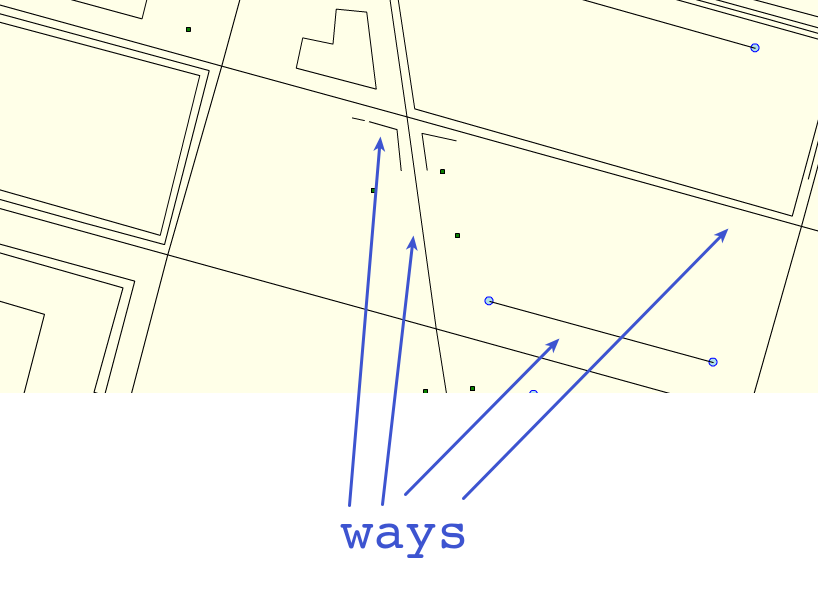
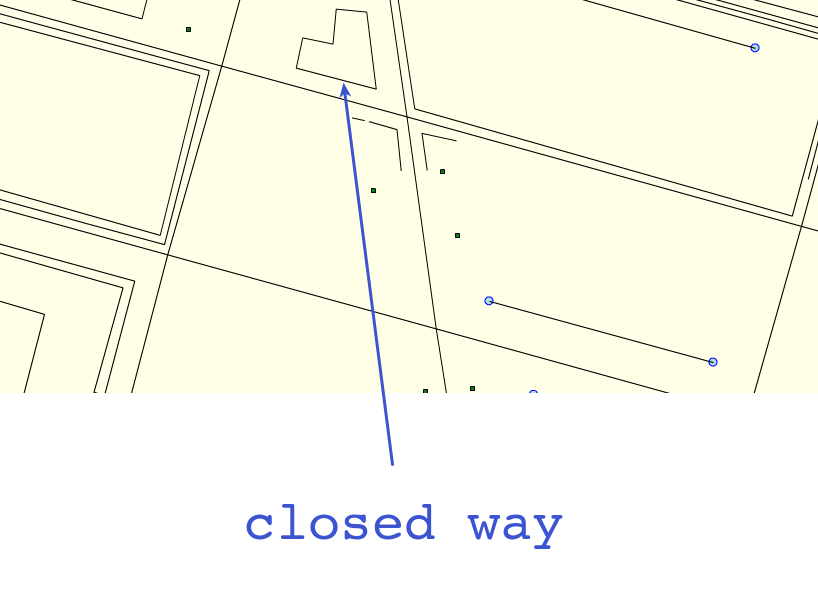
what does the data look like?
shapes
- nodes (points)
- ways (lines)
- closed ways (polygons)
nodes, ways, closed ways
are just shapes with no meaning until you give them attributes, as in any GIS
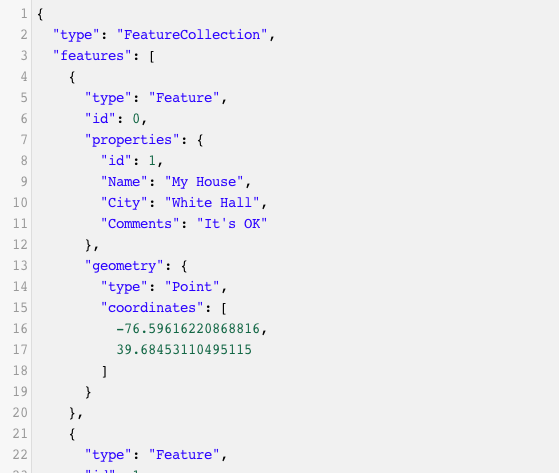
so you have to add attributes
less like a table, more like GeoJSON properties
a table wouldn't work because:
- there would be thousands of columns
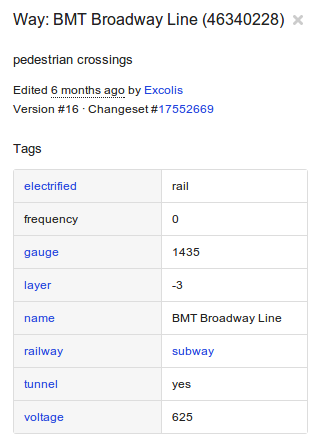
a table wouldn't work because:
- there would be thousands of columns
- and most of those columns would be empty (eg 'electrified')
a table wouldn't work because:
- there would be thousands of columns
- and most of those columns would be empty (eg 'electrified')
- what you could map would be predetermined
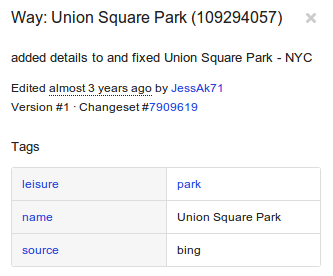
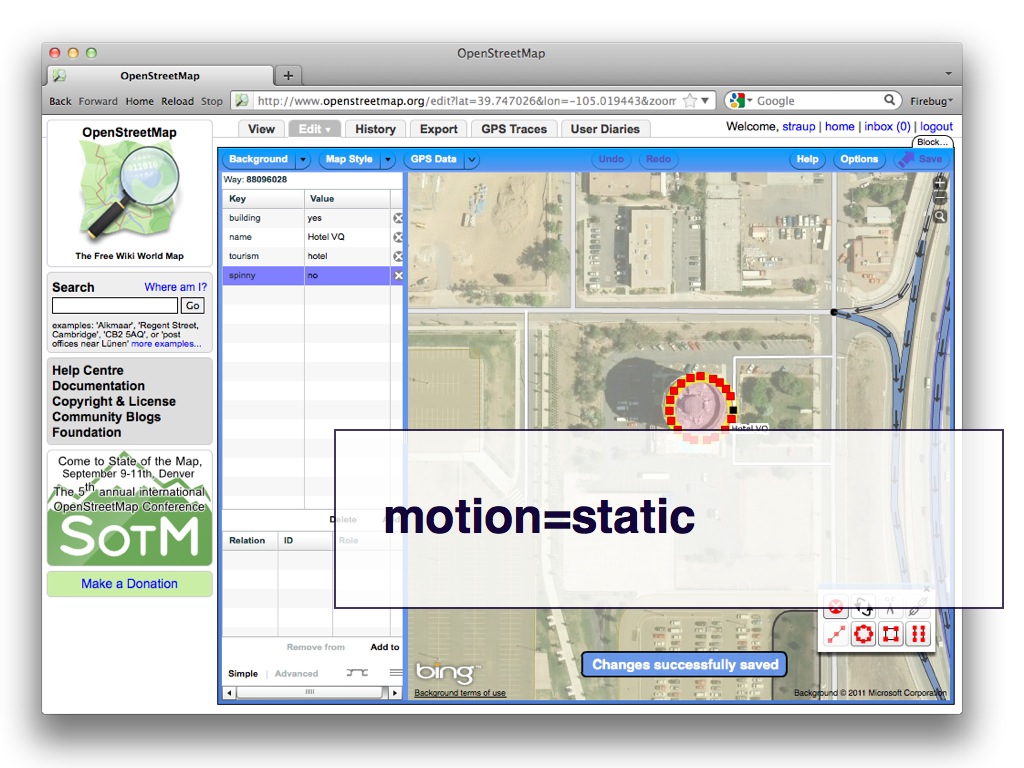
tags
name=Union Square West
tags
we make them up as we go.
tags
we make them up as we go. really.
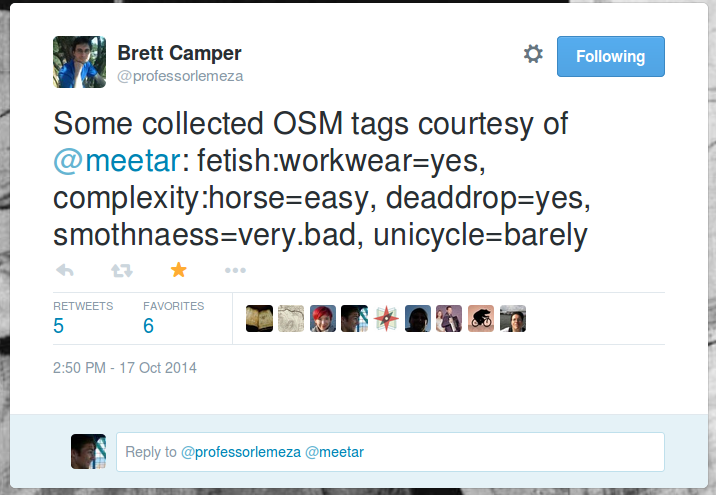
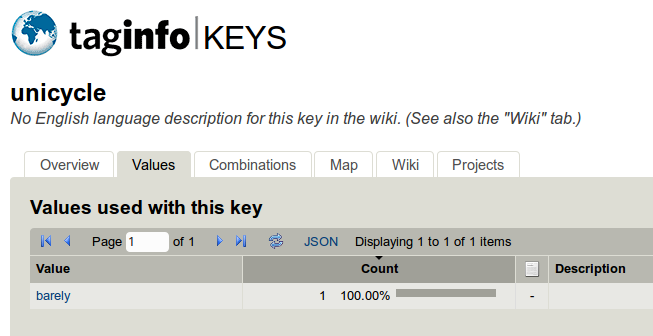
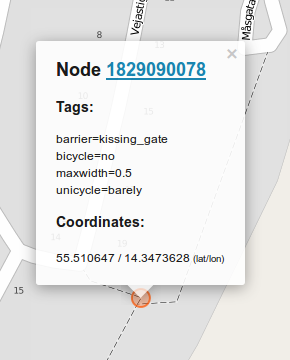
folksonomy
folksonomy
a collaborative system of categorization
you can tag things any way you want
but if you want your data to be useful (and show up on maps!), you should try to be consistent with the community
look around for similar features, mimic those
when you're looking for the way to tag something
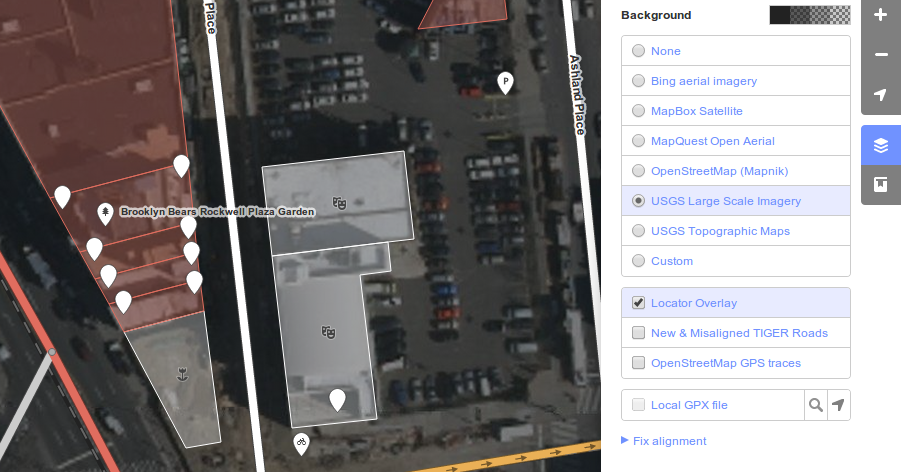
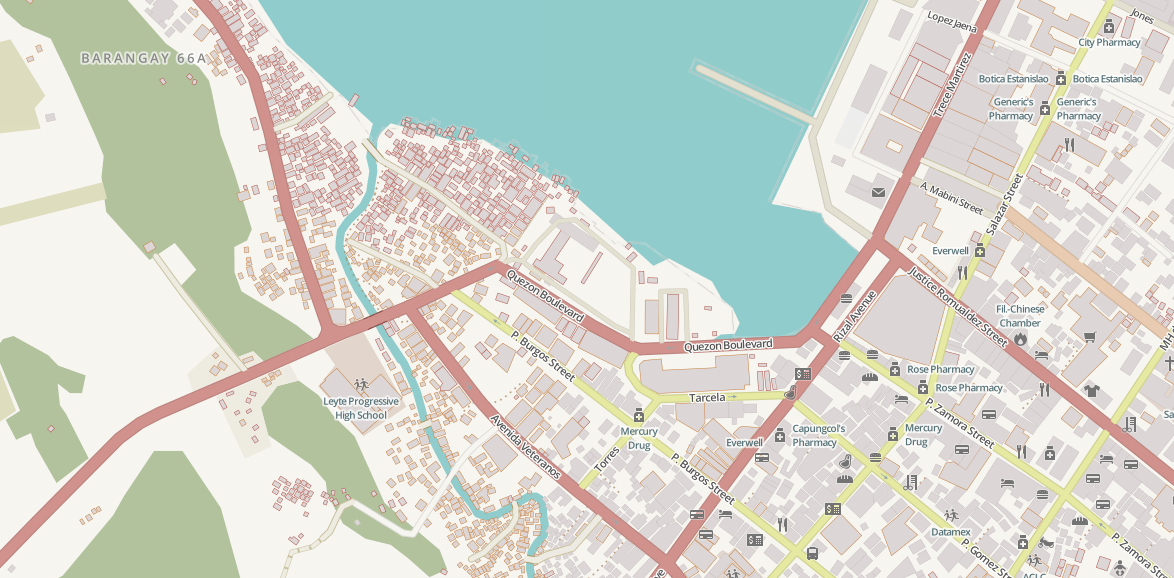
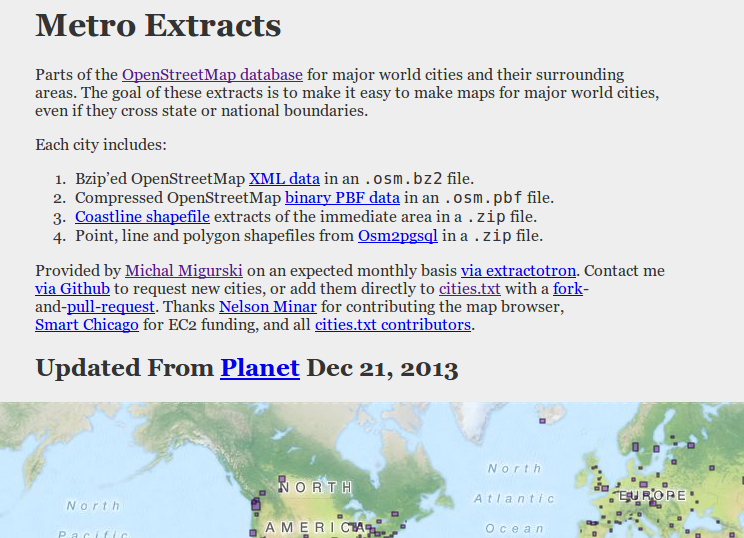
let's look at some OSM data
let's look at some OSM data
mapzen.com/metro-extracts
how does the data get there?
imports
editors
aerial imagery
GPS
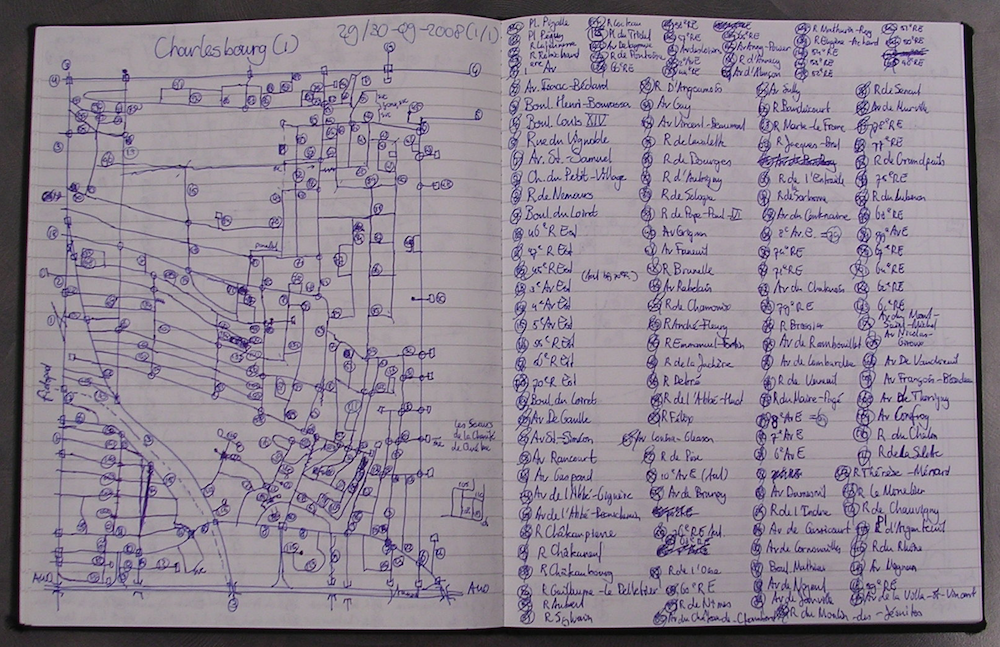
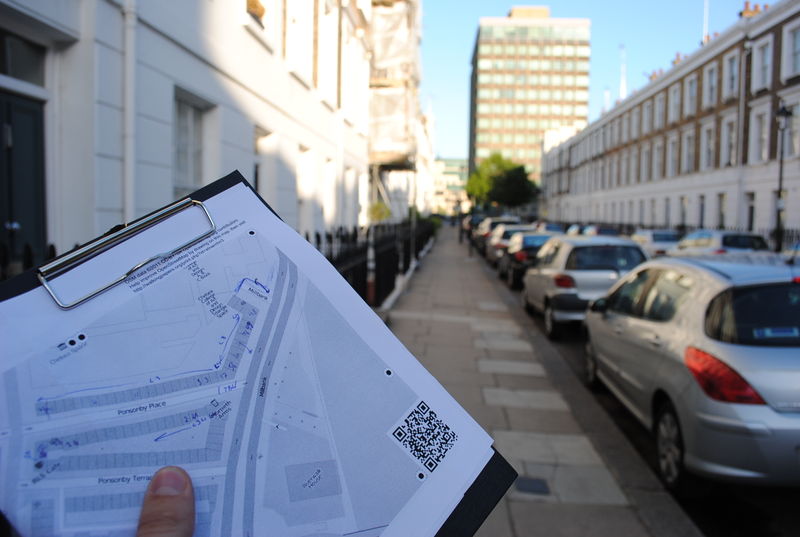
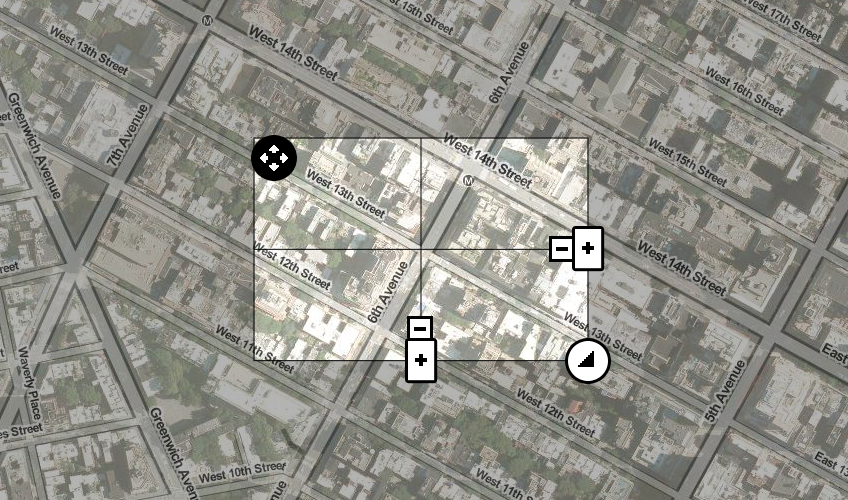
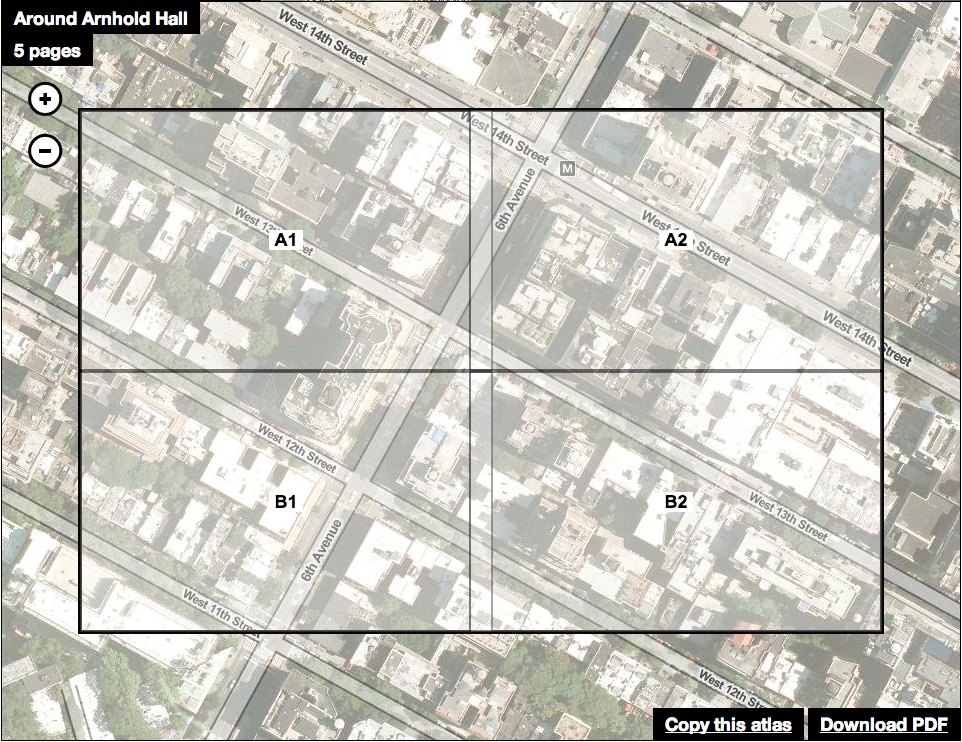
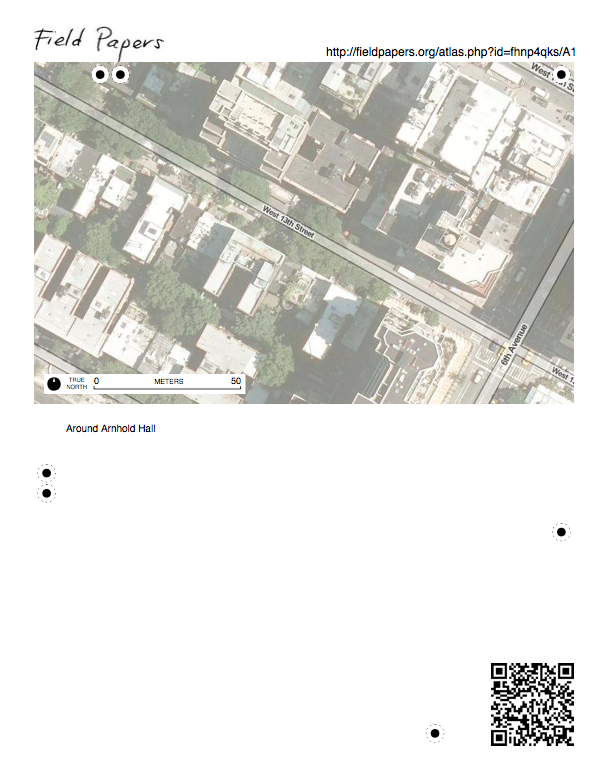
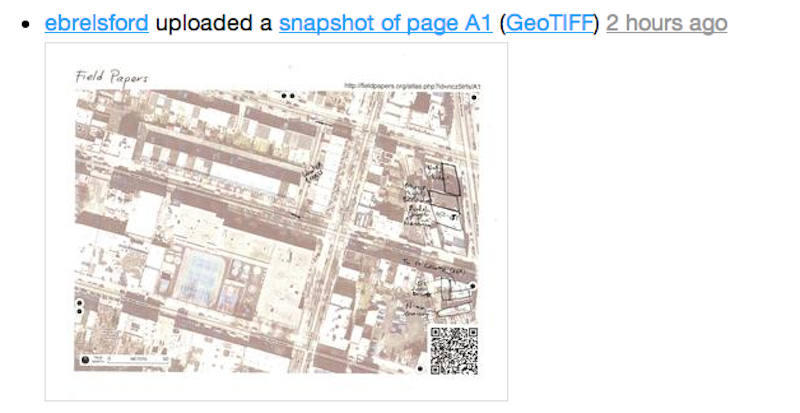
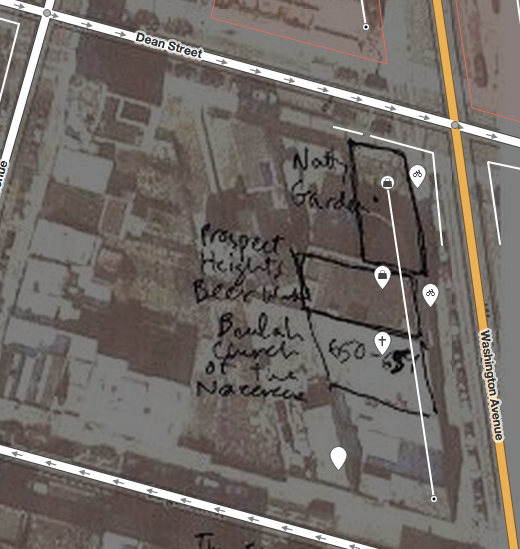
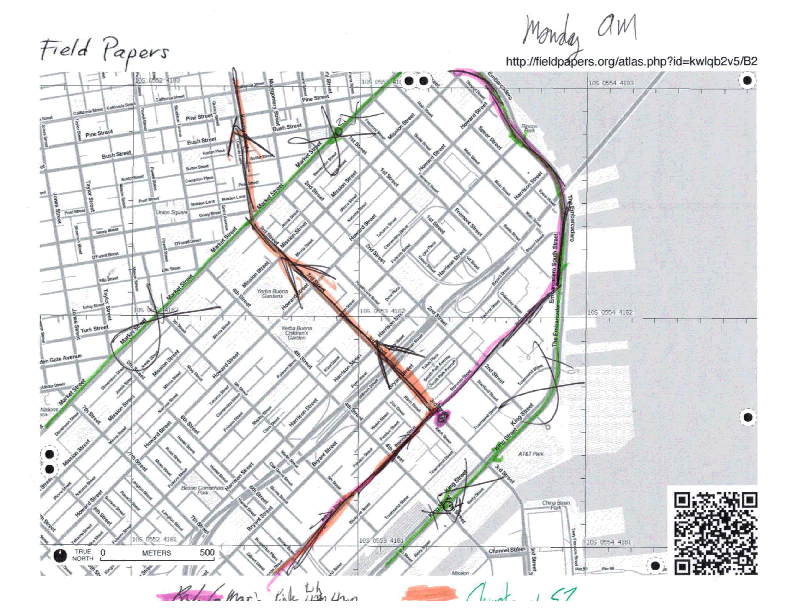
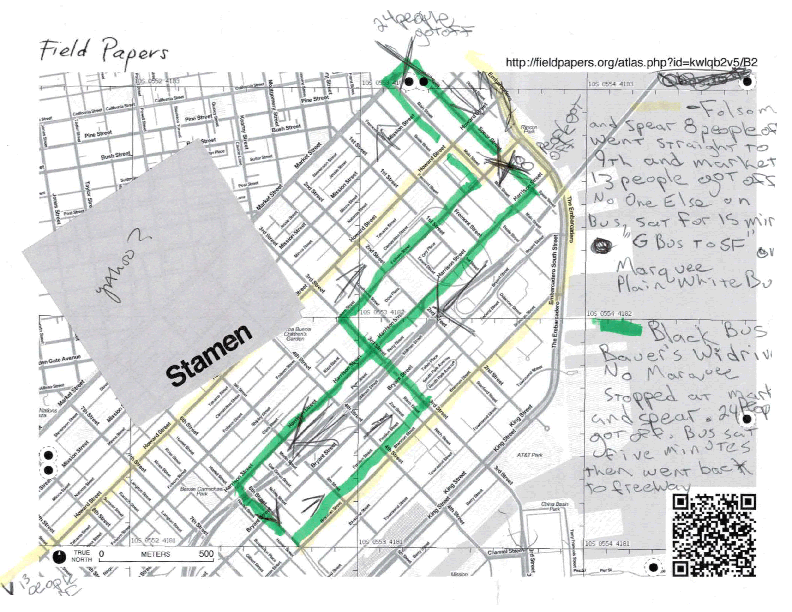
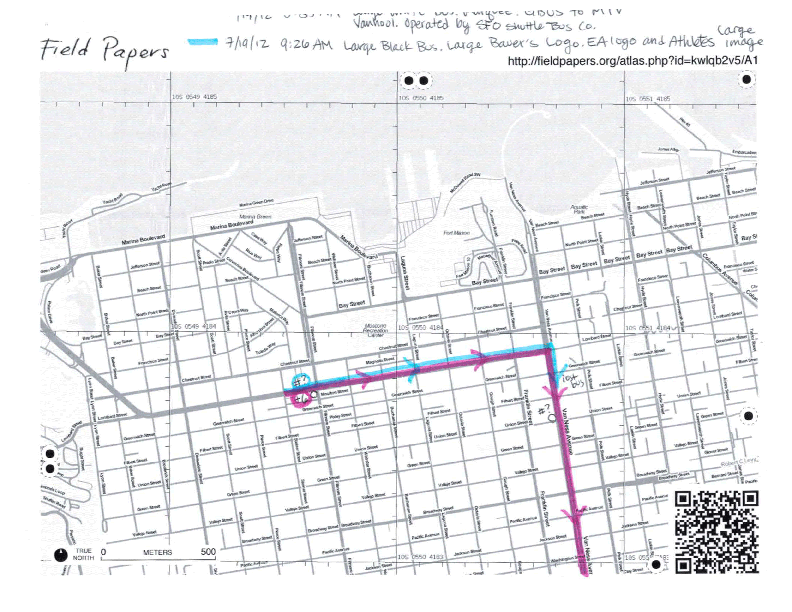
Field Papers
Field Papers
"a tool to help you create a multi-page atlas of anywhere in the world"
fieldpapers.org
get data in OSM:
- imports (but don't)
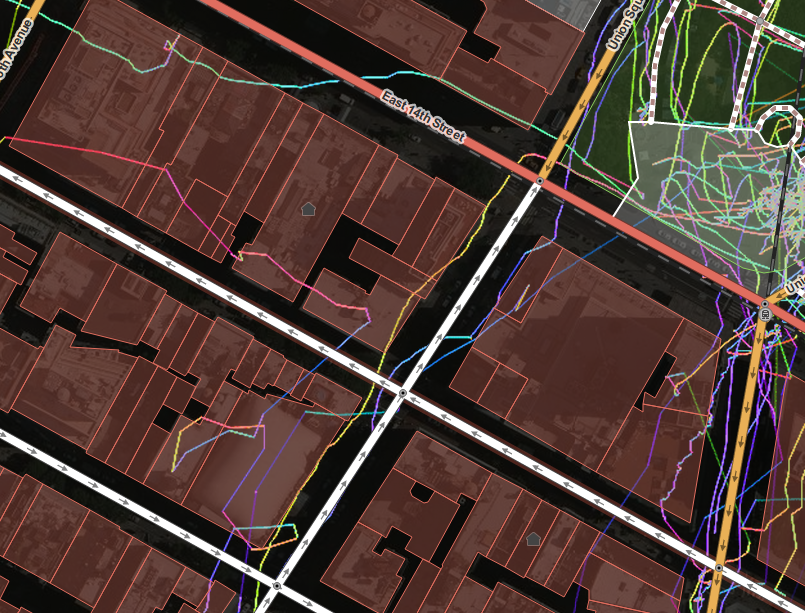
- online editor, using aerial imagery
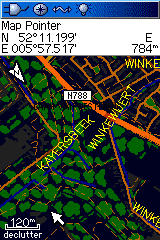
- GPS
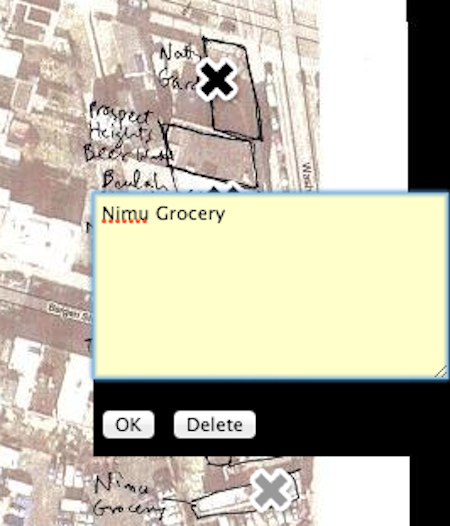
- Field Papers
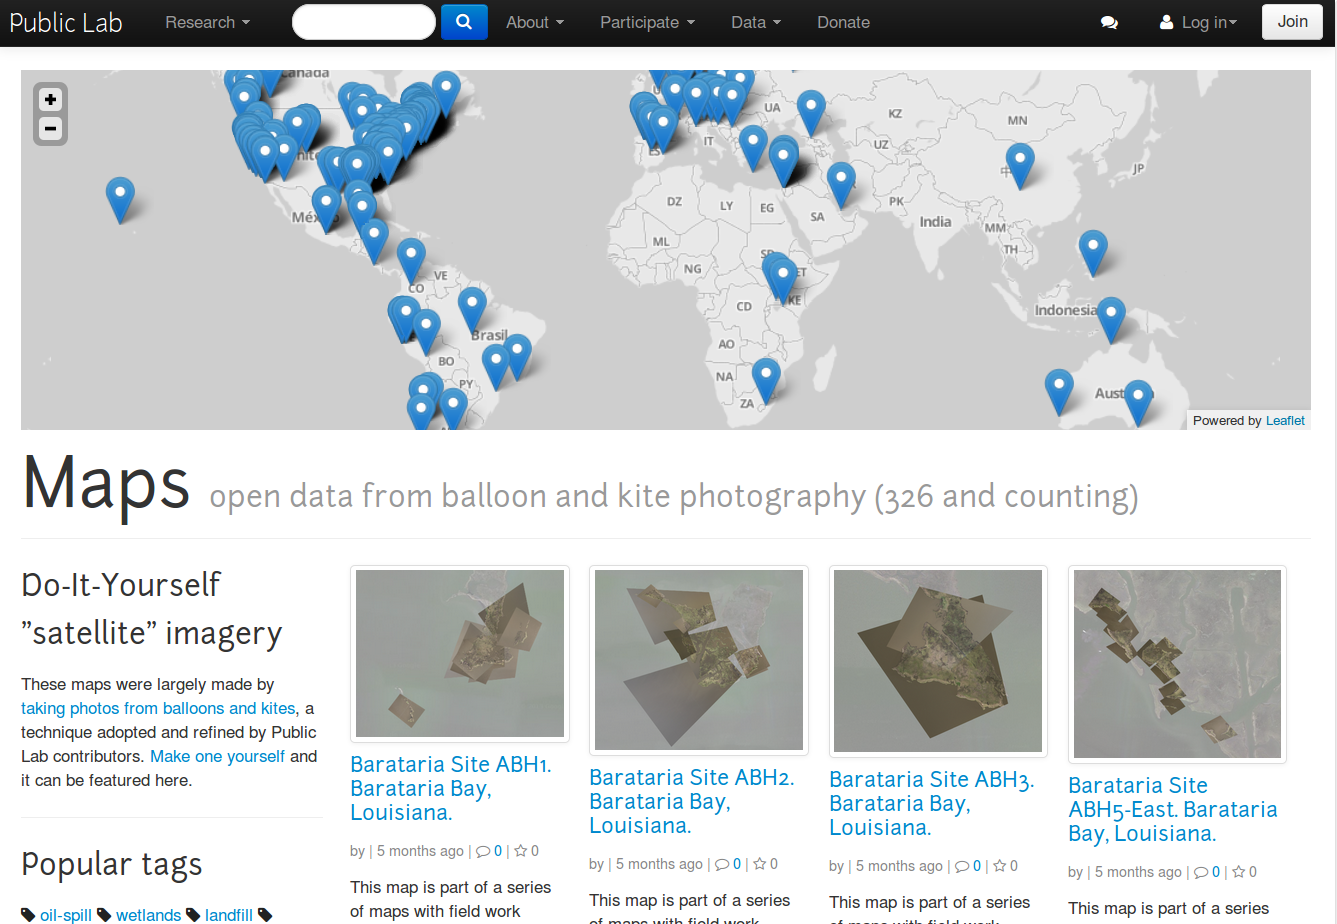
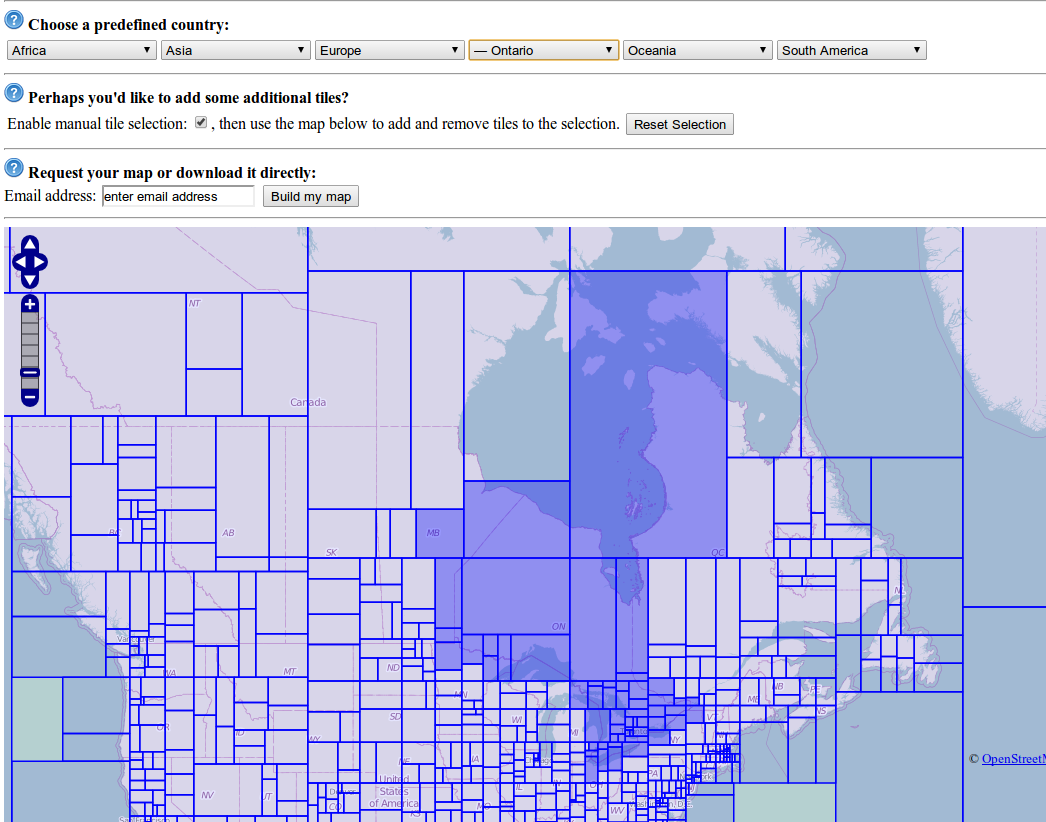
how do you use the data?
export
export
you'll have to do some extra work to get the data in a useful format
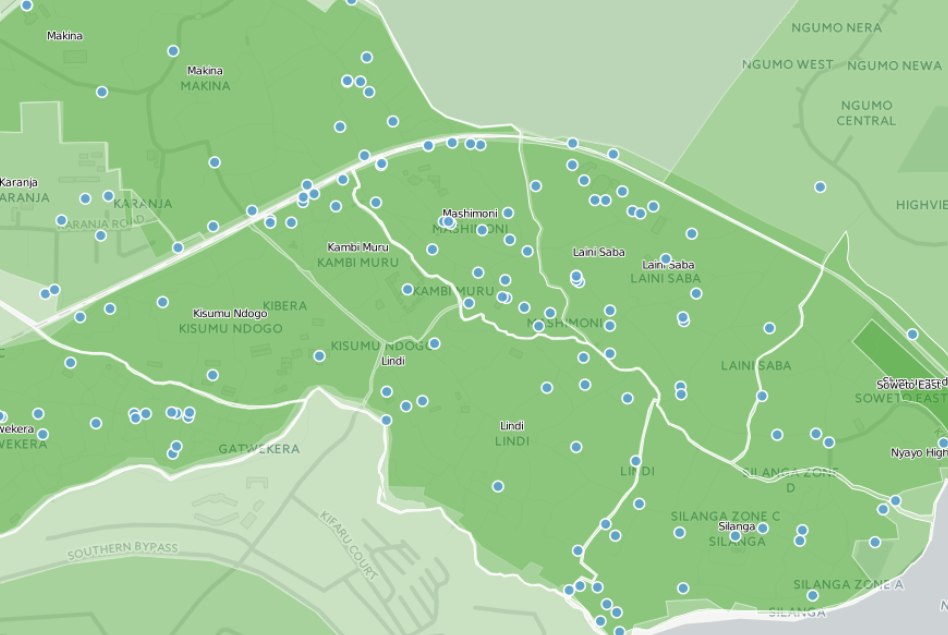
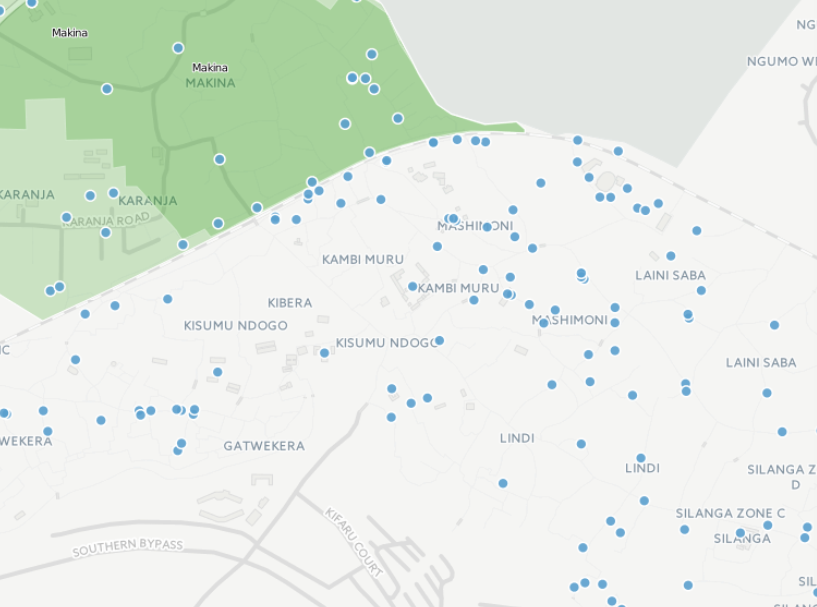
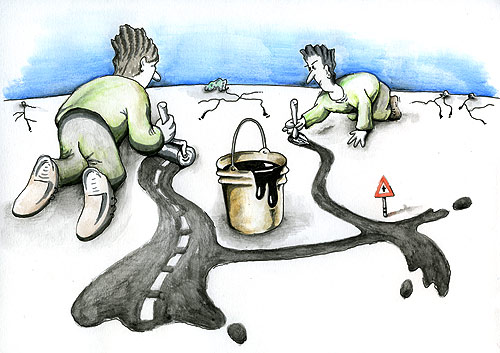
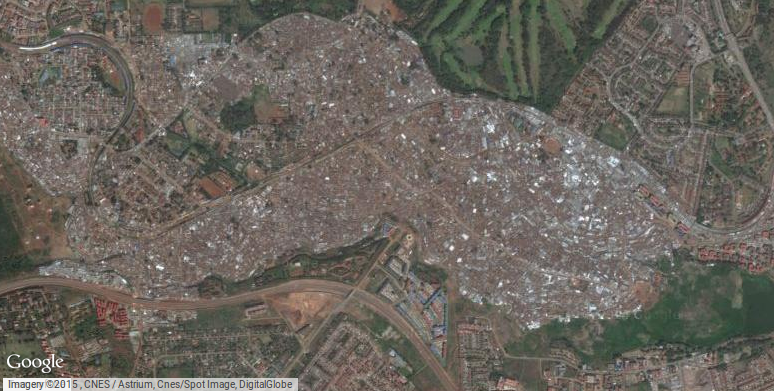
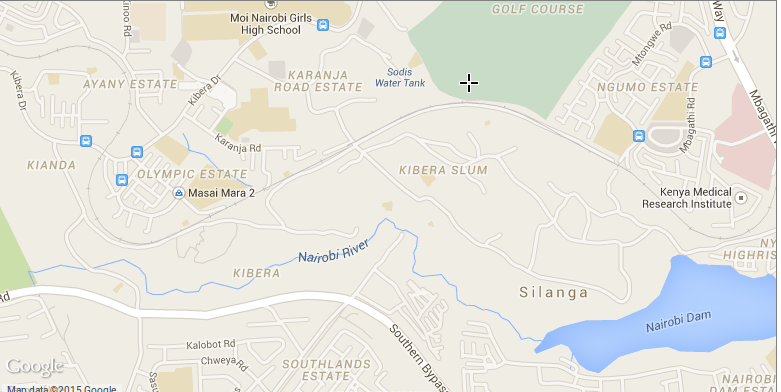
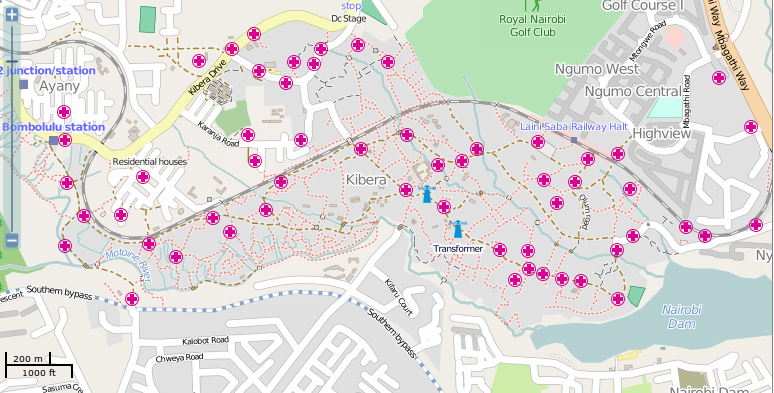
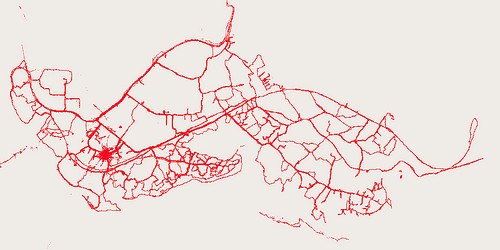
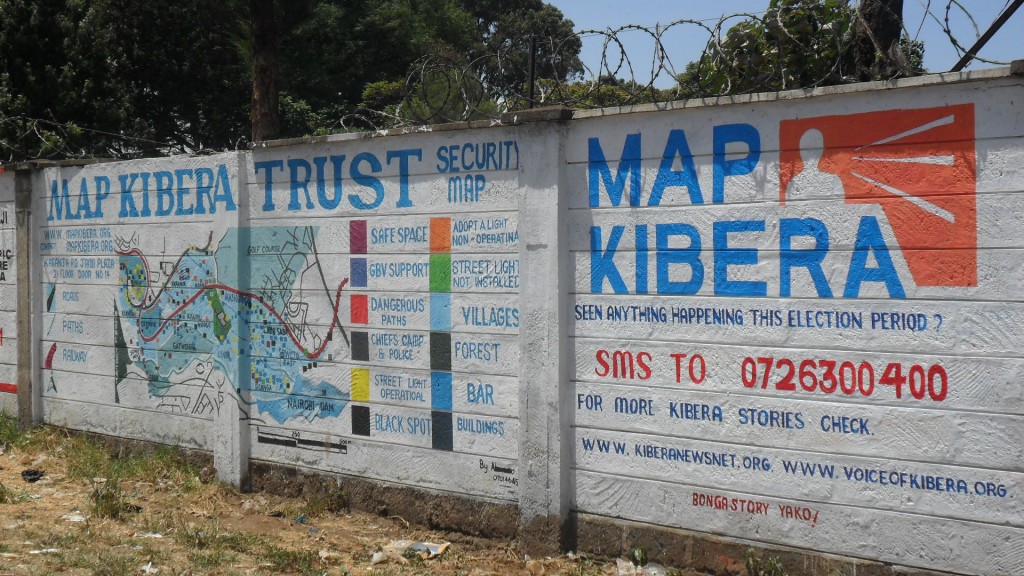
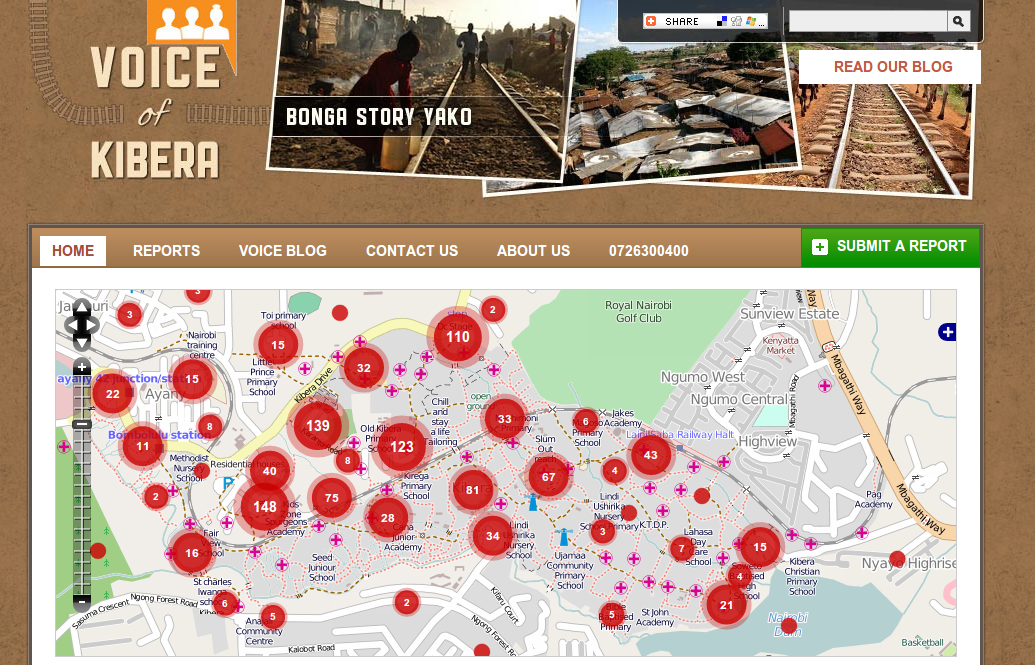
map kibera
1. trace the roads using aerial imagery
2. use GPS to collect point data and correct roads
"In the intense density of Kibera, selecting which features are 'important' is a judgment call and a matter of interest."
Map Kibera Blog
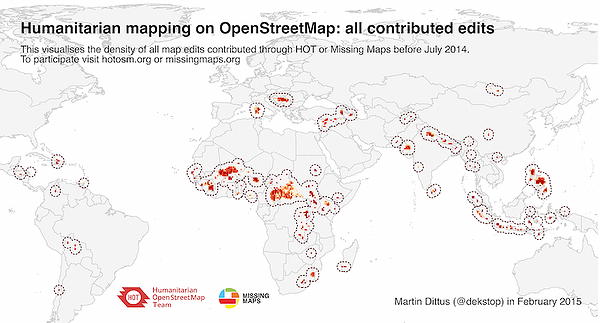
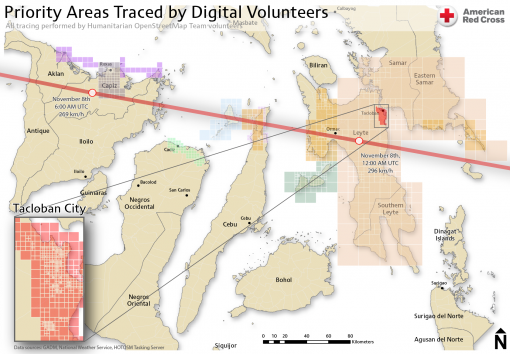
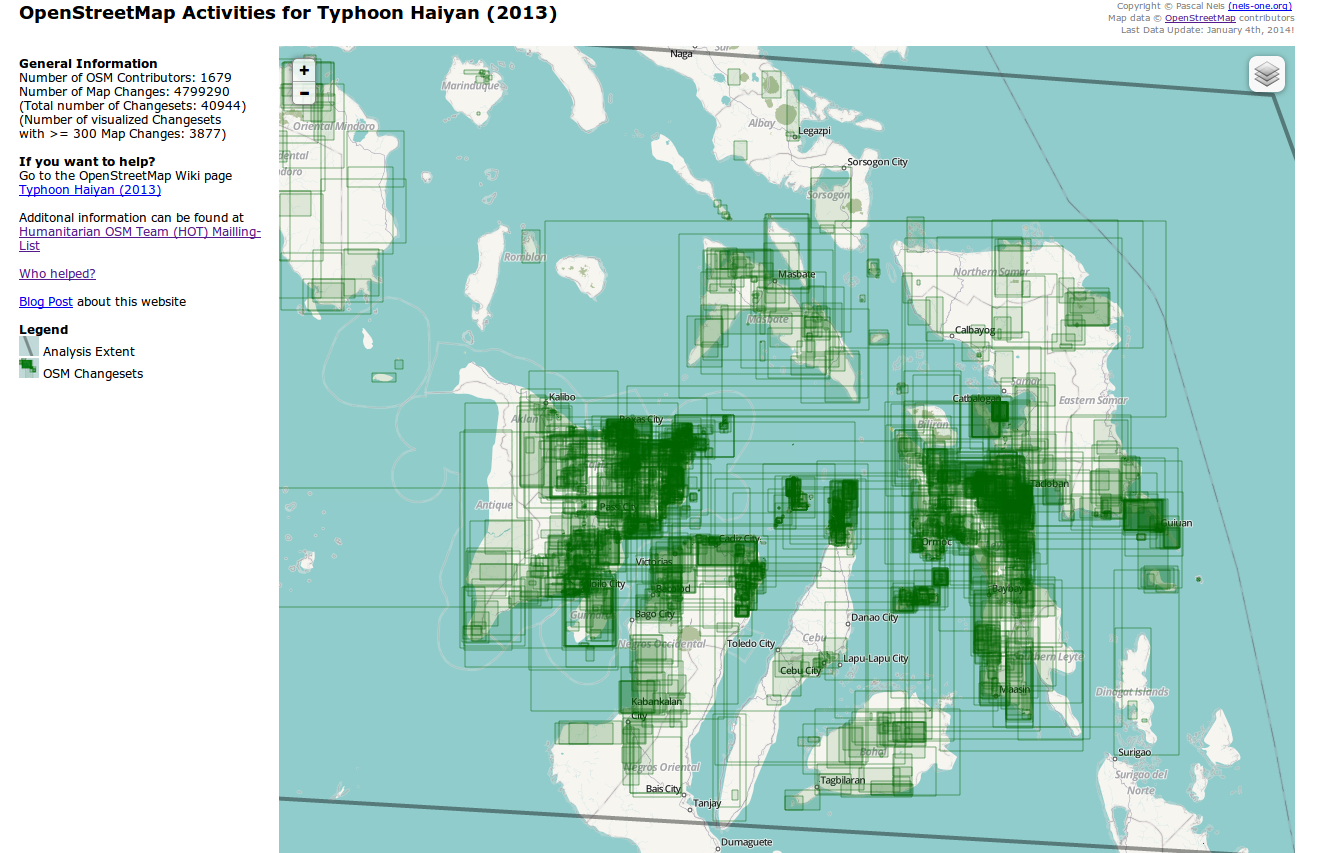
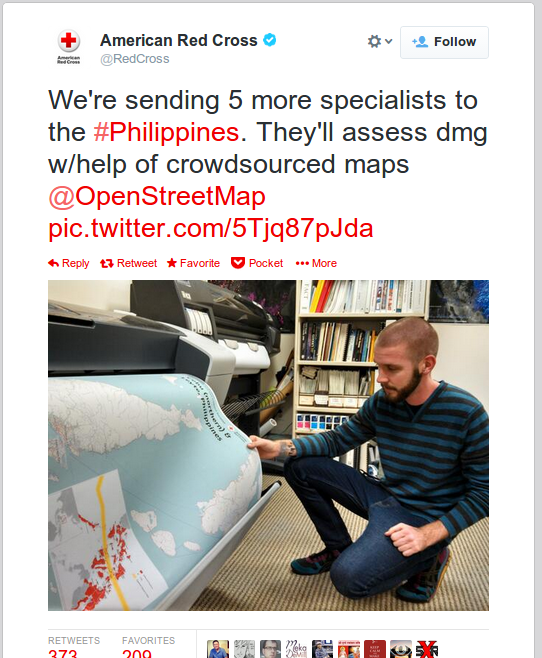
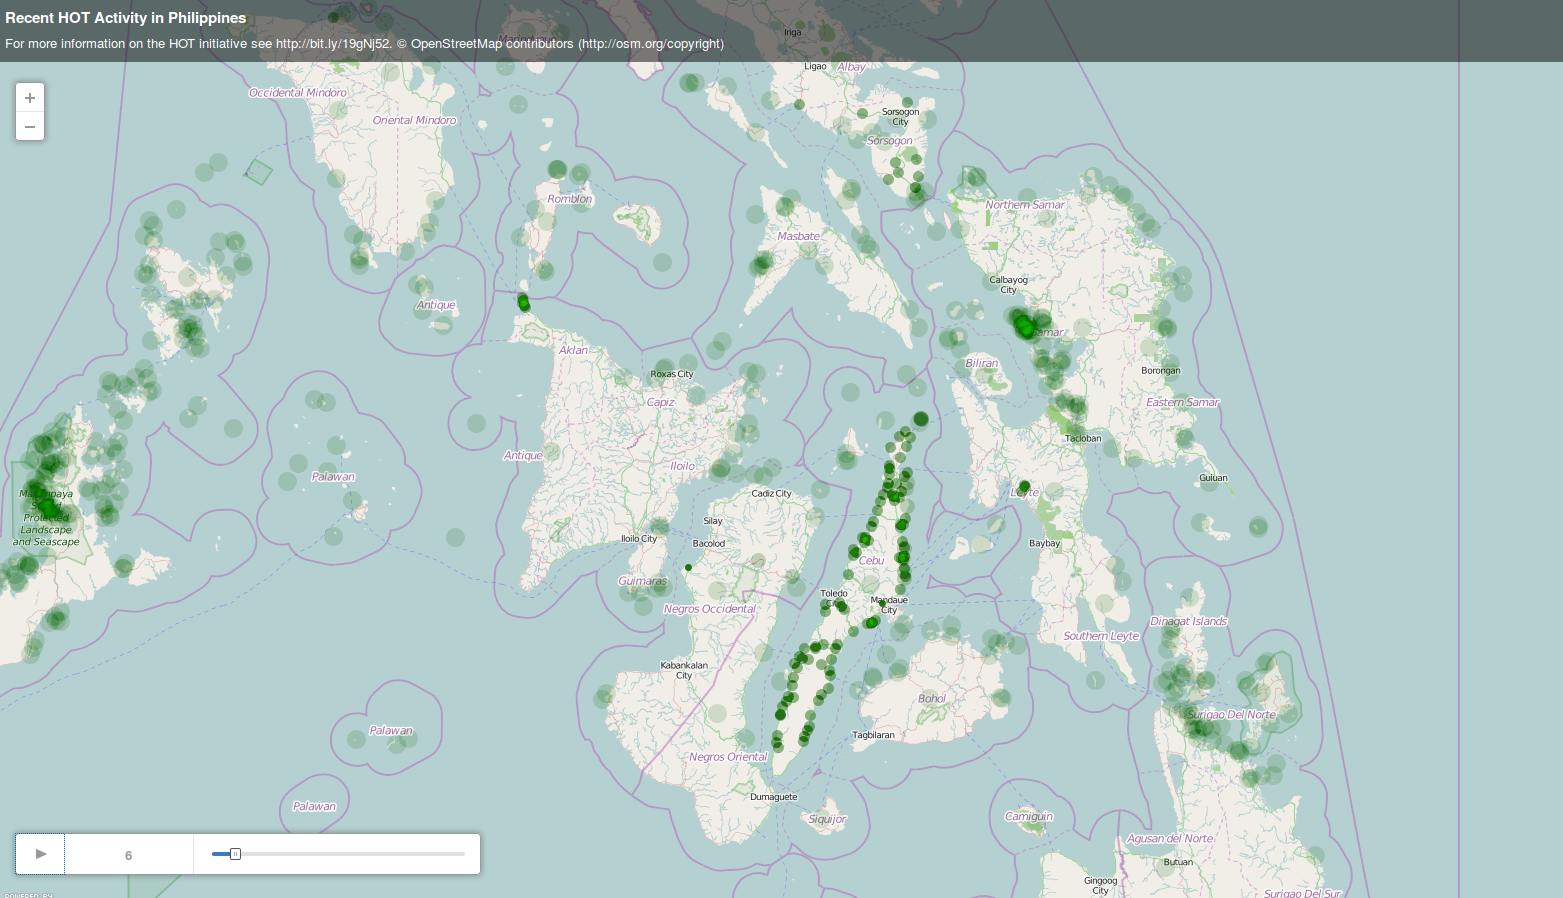
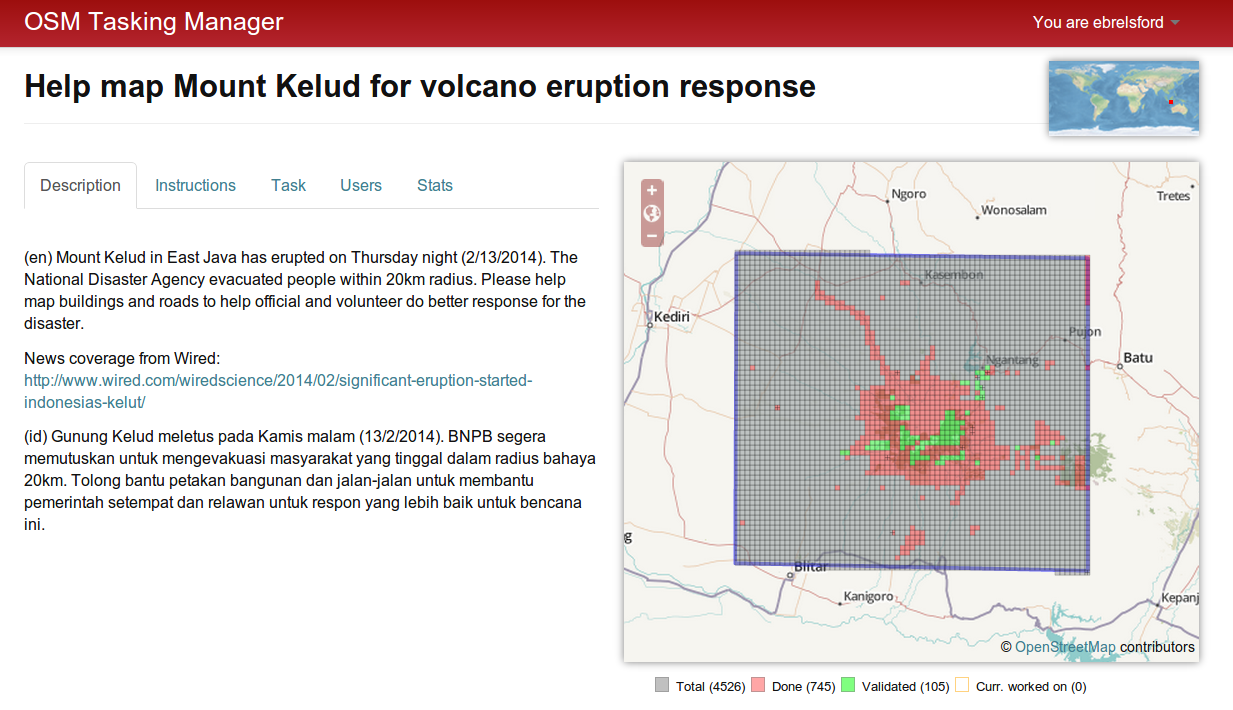
Humanitarian OpenStreetMap Team (HOT)
HOT in coordination with:
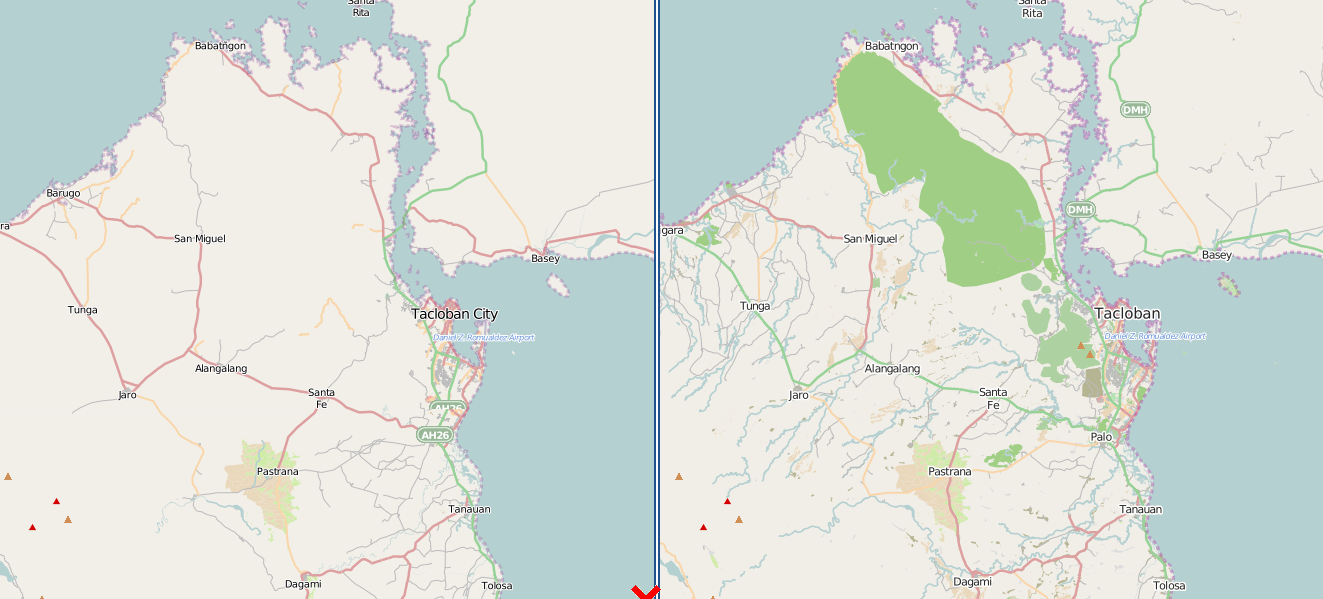
1. pre-typhoon (November 7), get the base map up-to-speed
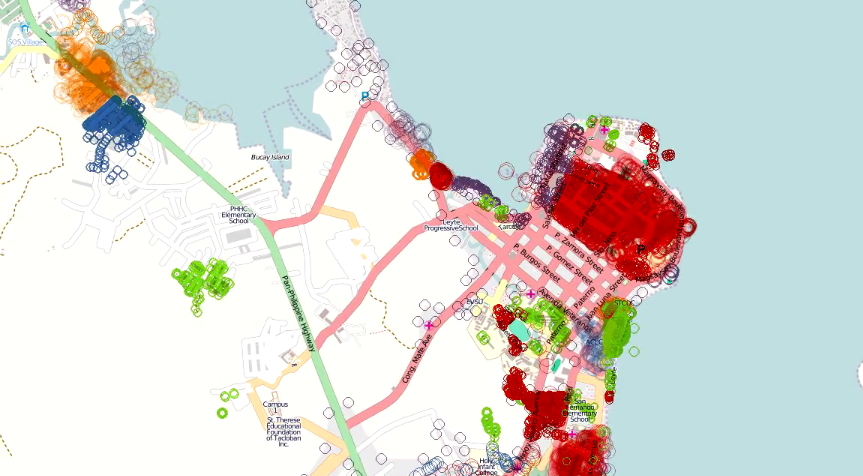
2. post-typhoon (November 13), use new aerial imagery to try to assess damage
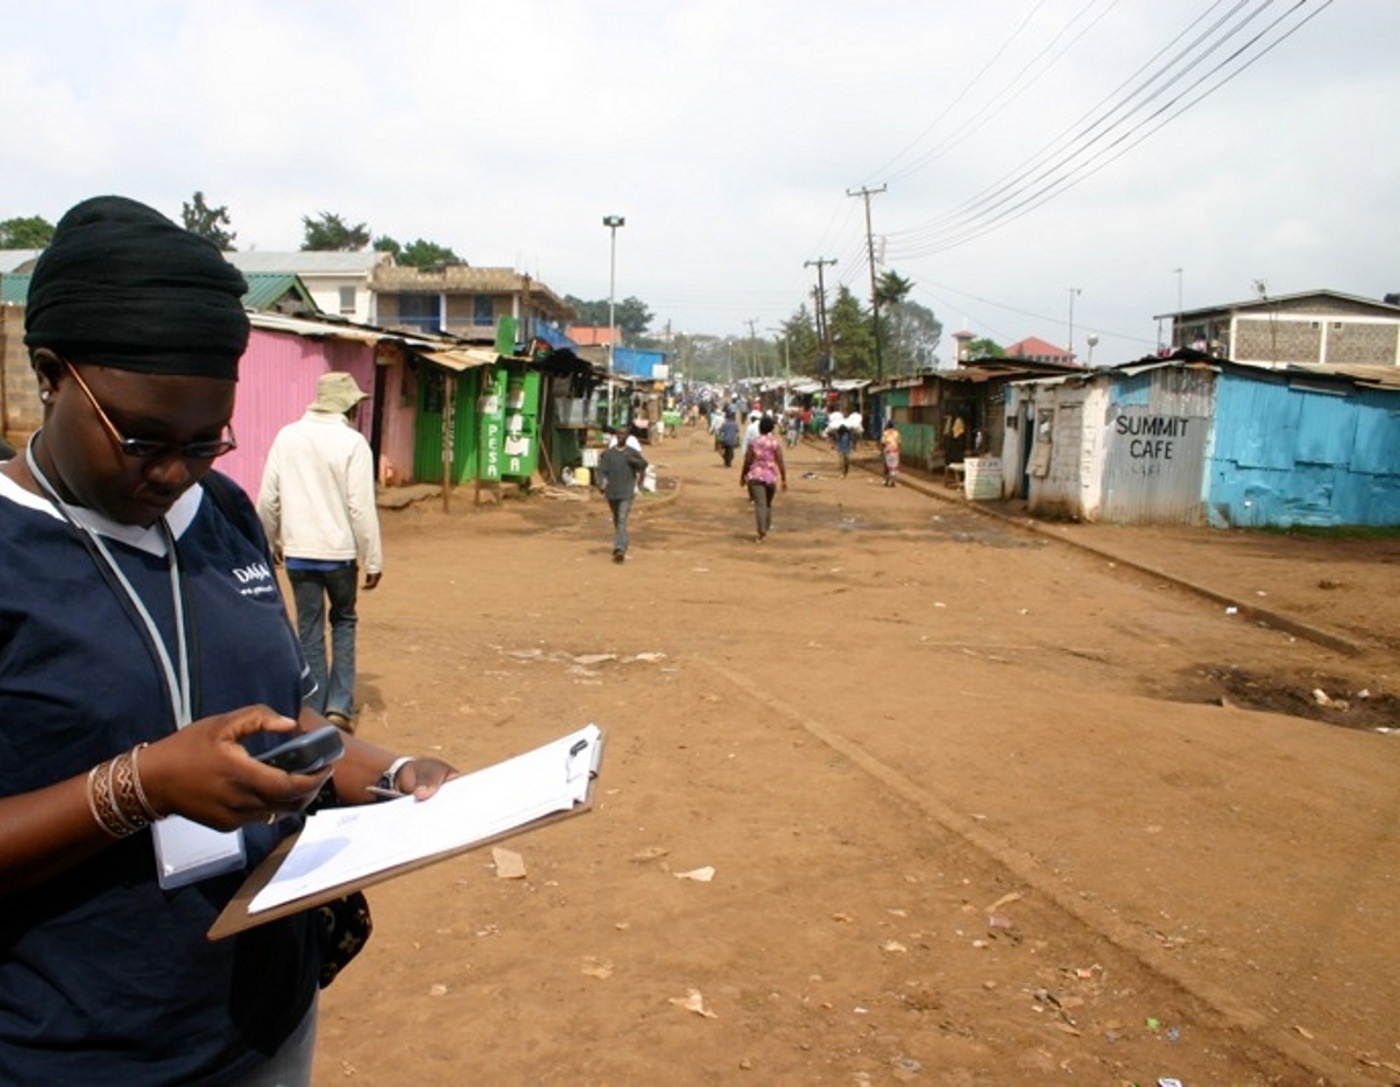
using it on the ground
- Field Papers supports humanitarian layer (so can show you damaged buildings)
using it on the ground
- Field Papers supports humanitarian layer (so can show you damaged buildings)
- Garmin exports for GPS receivers